Task 1 · Dynamic Mixed Chart
You should spend about 20 minutes on this task. Write at least 150 words.
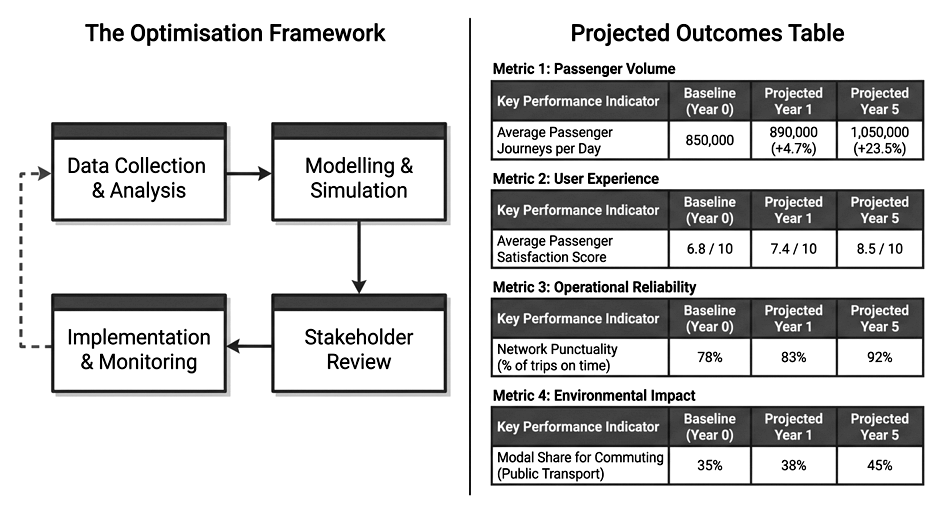
The diagram and table below outline a city’s strategic framework for public transport network optimisation and present the projected outcomes of its implementation over a five-year period.
Summarise the information by selecting and reporting the main features, and make comparisons where relevant.
Want to see your estimated band score?
Check your writing scorePart 1 · Band 9 Sample Answer
The diagram sets out a cyclical, four-stage approach to improving a city’s public transport network, while the tables forecast its effects on passenger demand, user experience, reliability and public transport use over five years.
Overall, the framework moves from evidence gathering through assessment and consultation to implementation, after which monitoring data feed back into the opening stage. All four performance measures are expected to improve, with modest gains in the first year becoming larger by Year 5.
Initially, transport data are collected and analysed before being used for modelling and simulation. The resulting proposals then undergo stakeholder review. Once this consultation is complete, changes are implemented and their performance monitored. A dashed return arrow from the final stage to data collection indicates that the process is iterative rather than a one-off exercise.
Average passenger journeys per day are projected to rise from 850,000 at baseline to 890,000 in Year 1, an increase of 4.7%. By Year 5, the total is forecast to reach 1.05 million, representing 23.5% growth over the starting level. Passenger satisfaction follows a similar upward path, improving from 6.8 out of 10 to 7.4 after one year and 8.5 after five.
Operational and environmental measures also strengthen. Network punctuality is expected to increase from 78% of trips to 83% in Year 1 and 92% in Year 5, an overall gain of 14 percentage points. Meanwhile, public transport’s share of commuting is forecast to climb from 35% to 38% and ultimately 45%, a ten-point rise across the period.
Part 1 · Band 8 Sample Answer
The diagram illustrates a city’s four-part strategy for optimising its public transport system, and the tables show predicted changes in four indicators after one and five years.
Overall, the strategy is a continuous cycle beginning with data analysis and ending with implementation and monitoring, whose results are returned to the first stage. The projections are positive: passenger numbers, satisfaction, punctuality and public transport’s share of commuting are all expected to rise, particularly by Year 5.
At the beginning of the framework, relevant information is collected and analysed. It is then passed to the modelling and simulation stage, after which proposed changes are considered in a stakeholder review. The measures are subsequently implemented and monitored. Finally, feedback from this stage enters the next round of data collection, allowing the network to be adjusted continuously.
Daily passenger journeys are forecast to increase from a baseline of 850,000 to 890,000 in the first year, equivalent to 4.7% growth. This figure is expected to reach 1,050,000 by Year 5, which is 23.5% above the baseline. Average satisfaction is also predicted to improve, from 6.8 out of 10 initially to 7.4 in Year 1 and 8.5 in Year 5.
The proportion of trips operating on time should rise from 78% to 83% during the first year and then to 92% after five years. Similarly, the modal share of public transport for commuting is projected to grow from 35% at baseline to 38% and 45% respectively. These represent five-year increases of 14 and 10 percentage points.
Part 1 · Band 7 Sample Answer
The diagram shows a four-stage framework for improving a city’s public transport network, while the tables provide projected results for four measures over a five-year period.
Overall, the optimisation process is a cycle which starts with collecting data and finishes with implementing and monitoring changes. The information from the final stage is used to begin the process again. All the performance indicators are predicted to improve in both Year 1 and Year 5.
First, data about the transport system are collected and analysed. These findings are passed to the modelling and simulation stage. The proposed plans are then examined through a stakeholder review before they move to implementation and monitoring. A return arrow connects this last stage with data collection, showing that further improvements can be made.
The average number of passenger journeys per day is expected to rise from 850,000 in the baseline year to 890,000 after one year. This is an increase of 4.7%. By Year 5, the number should reach 1,050,000, or 23.5% above the figure. Passenger satisfaction is also forecast to increase, from 6.8 out of 10 to 7.4 and then 8.5.
In terms of reliability, the percentage of trips running on time is projected to grow from 78% to 83% in Year 1 and 92% in Year 5. Public transport’s share of commuting should rise from 35% at the start to 38% after one year and 45% after five years. The total increases for these two measures are therefore 14 and 10 percentage points respectively.