Task 1 · Static Mixed Chart
You should spend about 20 minutes on this task. Write at least 150 words.
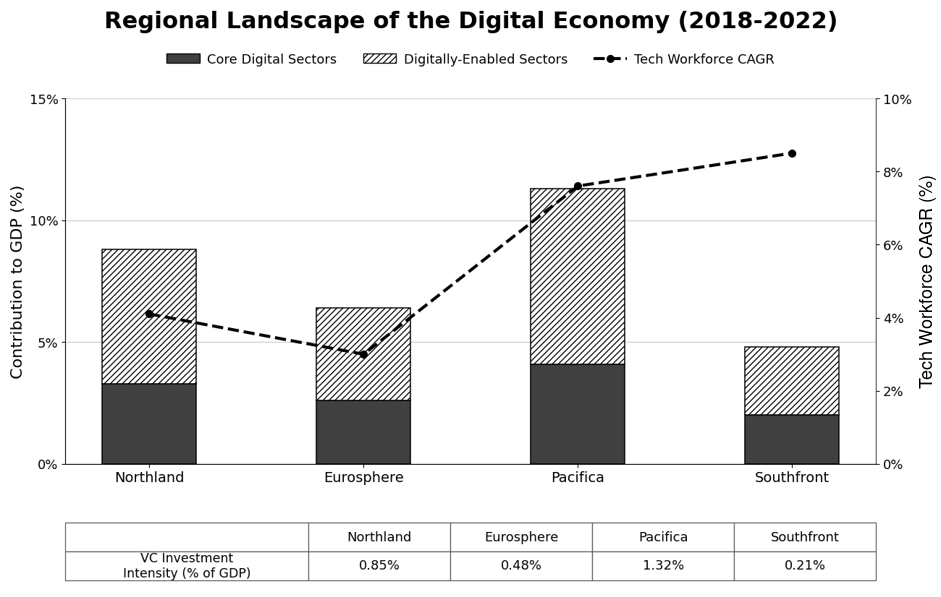
The chart and table below compare four major regions in terms of the digital economy’s contribution to GDP, venture capital investment as a percentage of GDP, and the compound annual growth rate of the tech workforce between 2018 and 2022.
Summarise the information by selecting and reporting the main features, and make comparisons where relevant.
Want to see your estimated band score?
Check your writing scorePart 1 · Band 9 Sample Answer
The chart compares four regions between 2018 and 2022 by showing the shares of GDP generated by core digital and digitally enabled sectors, together with the compound annual growth of their technology workforces. The table adds venture-capital investment as a proportion of regional GDP.
Overall, Pacifica had the largest digital economy and the greatest intensity of venture funding, while digitally enabled activity contributed more than core industries in every region. Workforce expansion followed a different ranking: Southfront recorded the fastest growth despite having the smallest digital contribution and lowest investment rate.
In Pacifica, digital activity accounted for approximately 11.3% of GDP, comprising just over 4% from core sectors and around 7.2% from digitally enabled ones. Northland ranked second with a total close to 9%, of which roughly 3.3% came from the core and 5.5% from enabled industries. The corresponding total in Eurosphere was about 6.4%, split into approximately 2.6% and 3.8%. Southfront’s figures were the lowest, at around 2% for core digital sectors and 2.8% for the enabled segment, producing a combined share of just under 5%.
Venture-capital data broadly reflected this order. Investment represented 1.32% of GDP in Pacifica and 0.85% in Northland, compared with 0.48% in Eurosphere and only 0.21% in Southfront. By contrast, Southfront’s technology workforce grew at roughly 8.5% annually, ahead of Pacifica at nearly 8%. Northland’s rate was just above 4%, while Eurosphere had the slowest expansion, at around 3%.
Part 1 · Band 8 Sample Answer
The chart presents the contribution of two parts of the digital economy to GDP in four regions and shows the annual growth rate of the technology workforce from 2018 to 2022. The table compares venture-capital investment as a percentage of GDP.
Overall, Pacifica recorded the highest digital-economy share and venture-capital intensity. Southfront was lowest on both measures, but had the most rapidly growing technology workforce. In all four regions, digitally enabled sectors made a larger contribution to GDP than core digital industries.
Pacifica’s digital economy represented just over 11% of GDP. Core sectors supplied approximately 4.1%, while digitally enabled activity contributed about 7.2%. Northland followed with a combined figure of almost 9%, divided into roughly 3.3% from core industries and 5.5% from enabled sectors. Eurosphere’s total was lower, at around 6.4%, including 2.6% and 3.8% respectively. Southfront had the smallest overall share, at just under 5%, with core and enabled contributions of approximately 2% and 2.8%.
Pacifica also attracted the most venture capital relative to its economy, at 1.32% of GDP. Northland ranked second at 0.85%, followed by Eurosphere at 0.48%, while Southfront received only 0.21%.
The pattern for workforce growth was notably different. Southfront achieved the highest compound annual rate, at approximately 8.5%, despite its low investment and digital output. Pacifica was close behind at nearly 8%. Northland’s technology workforce grew by just over 4% annually, whereas Eurosphere recorded the lowest rate, at about 3%.
Part 1 · Band 7 Sample Answer
The chart compares the contribution of core digital sectors and digitally enabled sectors to GDP in four regions between 2018 and 2022. It also shows technology workforce growth, while the table gives venture-capital investment as a share of GDP.
Overall, Pacifica had the largest digital economy and the highest level of venture-capital investment. Southfront had the lowest figures in these areas, although its technology workforce grew the fastest. Digitally enabled sectors contributed more than core digital sectors in every region.
Pacifica’s two digital sectors together made up slightly more than 11% of GDP. Around 4.1% came from core sectors and approximately 7.2% from digitally enabled industries. Northland had the second-highest total, at nearly 9%, including about 3.3% from core digital activity and 5.5% from the enabled sector.
The figures were lower in Eurosphere and Southfront. Eurosphere’s total contribution was around 6.4%, with about 2.6% from the core and 3.8% from enabled industries. In Southfront, these two shares were approximately 2% and 2.8%, giving a total of just under 5%.
Venture-capital investment was equal to 1.32% of GDP in Pacifica, compared with 0.85% in Northland and 0.48% in Eurosphere. Southfront had the lowest figure, at 0.21%. However, its workforce growth rate was highest at roughly 8.5%, followed by Pacifica at nearly 8%. Northland recorded just over 4%, while Eurosphere was last at approximately 3%.