Task 1 · Dynamic Multiple-Line Graph
You should spend about 20 minutes on this task. Write at least 150 words.
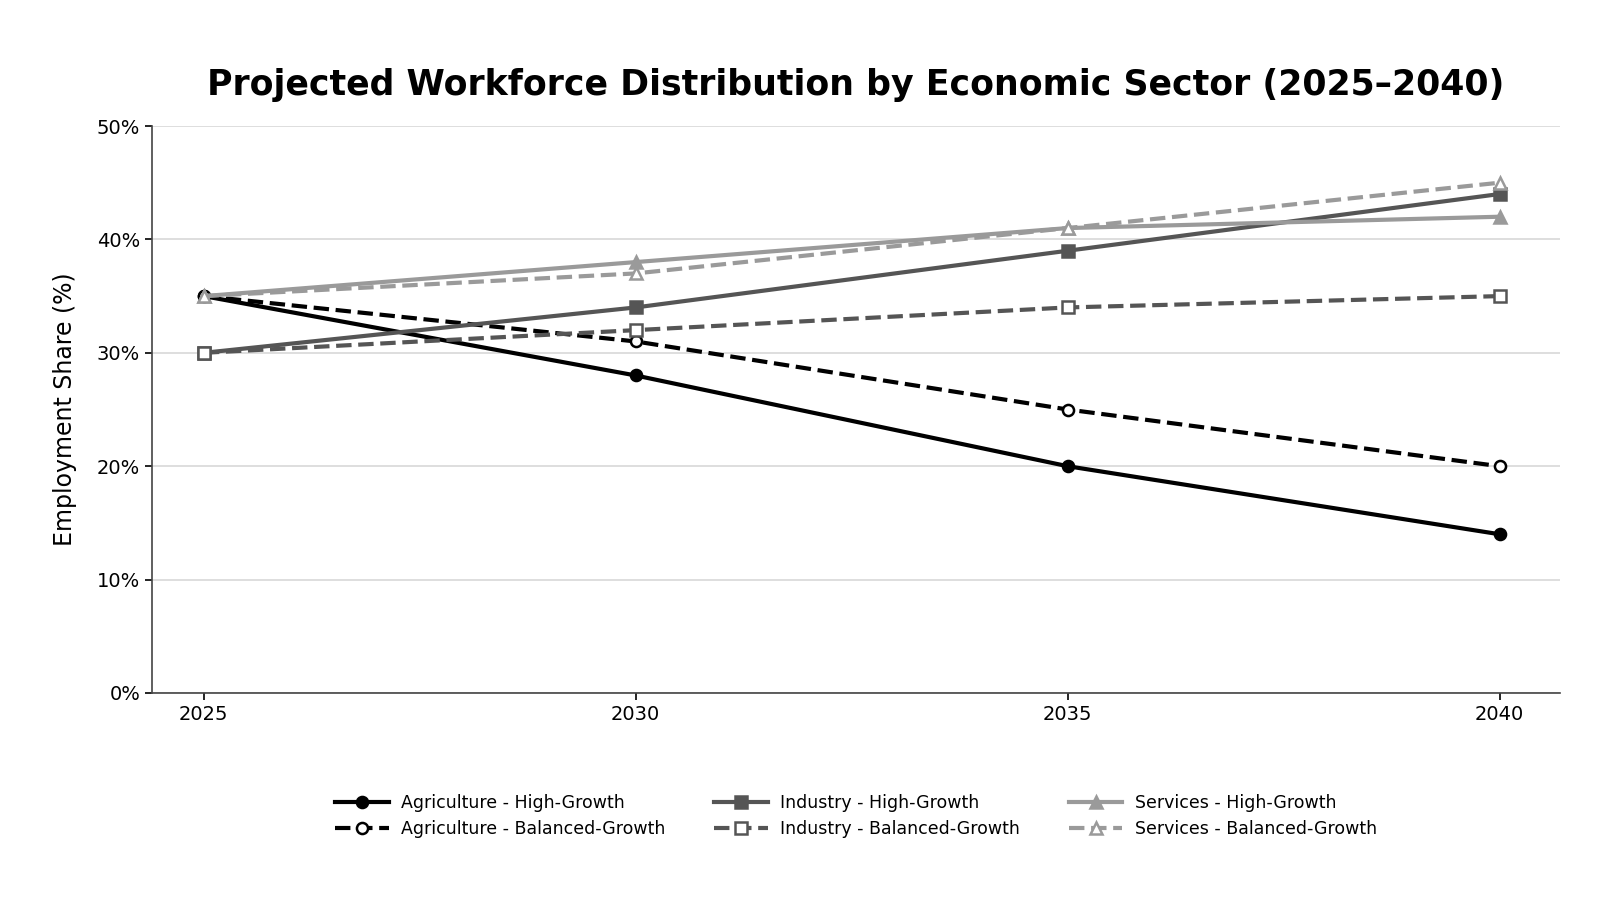
The chart below shows the projected changes in the percentage of the workforce employed in three broad sectors—agriculture, industry, and services—in a rapidly developing country from 2025 to 2040, based on two different economic growth scenarios.
Summarise the information by selecting and reporting the main features, and make comparisons where relevant.
Want to see your estimated band score?
Check your writing scorePart 1 · Band 9 Sample Answer
The line chart forecasts the proportions of workers employed in agriculture, industry and services in a developing country at five-year intervals from 2025 to 2040. Figures are presented for high-growth and balanced-growth scenarios.
Overall, both projections indicate a decisive shift away from agriculture towards the other sectors. This restructuring is considerably stronger under high growth, where industry is expected to become the largest employer by 2040. Under balanced growth, by contrast, services retain and extend their leading position.
In the high-growth scenario, agriculture and services each initially account for 35% of employment, compared with 30% for industry. The agricultural share then falls steeply to 28% in 2030 and 20% in 2035, before reaching only 14% in 2040. Industry follows the opposite pattern, rising successively to 34%, 39% and 44%. Services grow more moderately, from 35% to 38% and then 41%, after which their share edges up to 42%. Industry therefore overtakes services during the final five-year period.
The balanced-growth projection shows a less dramatic decline in agriculture, from 35% in 2025 to 31% in 2030, 25% in 2035 and 20% by 2040. Industrial employment increases gradually from 30% to 35% across the period. Services, meanwhile, rise steadily from 35% to 37%, 41% and finally 45%, leaving this sector ten percentage points ahead of industry. By 2040, compared with balanced growth, high growth produces a nine-point larger industrial share and a six-point smaller agricultural one, while its service figure is three points lower.
Part 1 · Band 8 Sample Answer
The chart illustrates how the employment shares of agriculture, industry and services are predicted to change in a rapidly developing nation between 2025 and 2040 under high-growth and balanced-growth conditions.
Overall, agriculture is projected to lose workers proportionally in both scenarios, while industry and services gain them. The high-growth model produces a much faster movement from agriculture into industry. In the balanced-growth case, services instead show the largest increase and remain the leading sector in 2040.
Agriculture begins at 35% of the workforce in both projections. With high growth, its share is expected to drop to 28% in 2030 and 20% in 2035, before ending at 14%. The corresponding decline under balanced growth is slower, with figures of 31%, 25% and 20%. Consequently, the difference between the two agricultural projections widens to six percentage points by the final year.
Industry accounts for 30% initially. Its share rises substantially under high growth, reaching 34% in 2030, 39% in 2035 and 44% in 2040. Balanced growth results in a gentler increase, to 32%, 34% and 35% respectively. Services also start at 35%. In the high-growth forecast, this proportion climbs to 38% and then 41%, but grows by only one further point in the last five years. Under balanced growth, it increases from 37% in 2030 to 41% in 2035 and 45% in 2040. Thus, industry narrowly leads services under high growth at the end, whereas services exceed industry by ten points in the balanced scenario.
Part 1 · Band 7 Sample Answer
The line chart compares the predicted percentages of the workforce employed in agriculture, industry and services from 2025 to 2040 under two economic growth scenarios.
Overall, the proportion working in agriculture is expected to decrease in both cases, while the figures for industry and services rise. These changes are stronger under high growth, especially for agriculture and industry. By 2040, industry is the largest sector in the high-growth scenario, whereas services rank first under balanced growth.
In 2025, agriculture and services both employ 35% of workers, while the remaining 30% work in industry. Under high growth, agriculture falls to 28% in 2030 and then to 20% in 2035. It reaches its lowest level of 14% in 2040. In comparison, industrial employment grows from 30% to 34%, 39% and finally 44%. The service sector also rises, although more slowly, reaching 38% in 2030, 41% in 2035 and 42% in the final year.
Under balanced growth, agriculture declines less quickly. Its share drops from 35% to 31% in 2030, followed by 25% in 2035 and 20% in 2040. Industry experiences a steady but small increase, moving from 30% to 32%, 34% and 35%. Services grow from 35% initially to 37% in 2030 and 41% five years later, before finishing at 45%. Therefore, in 2040 the balanced-growth service share is three percentage points higher than under high growth, while its industrial figure is nine points lower.