Task 1 · Dynamic Mixed Chart
You should spend about 20 minutes on this task. Write at least 150 words.
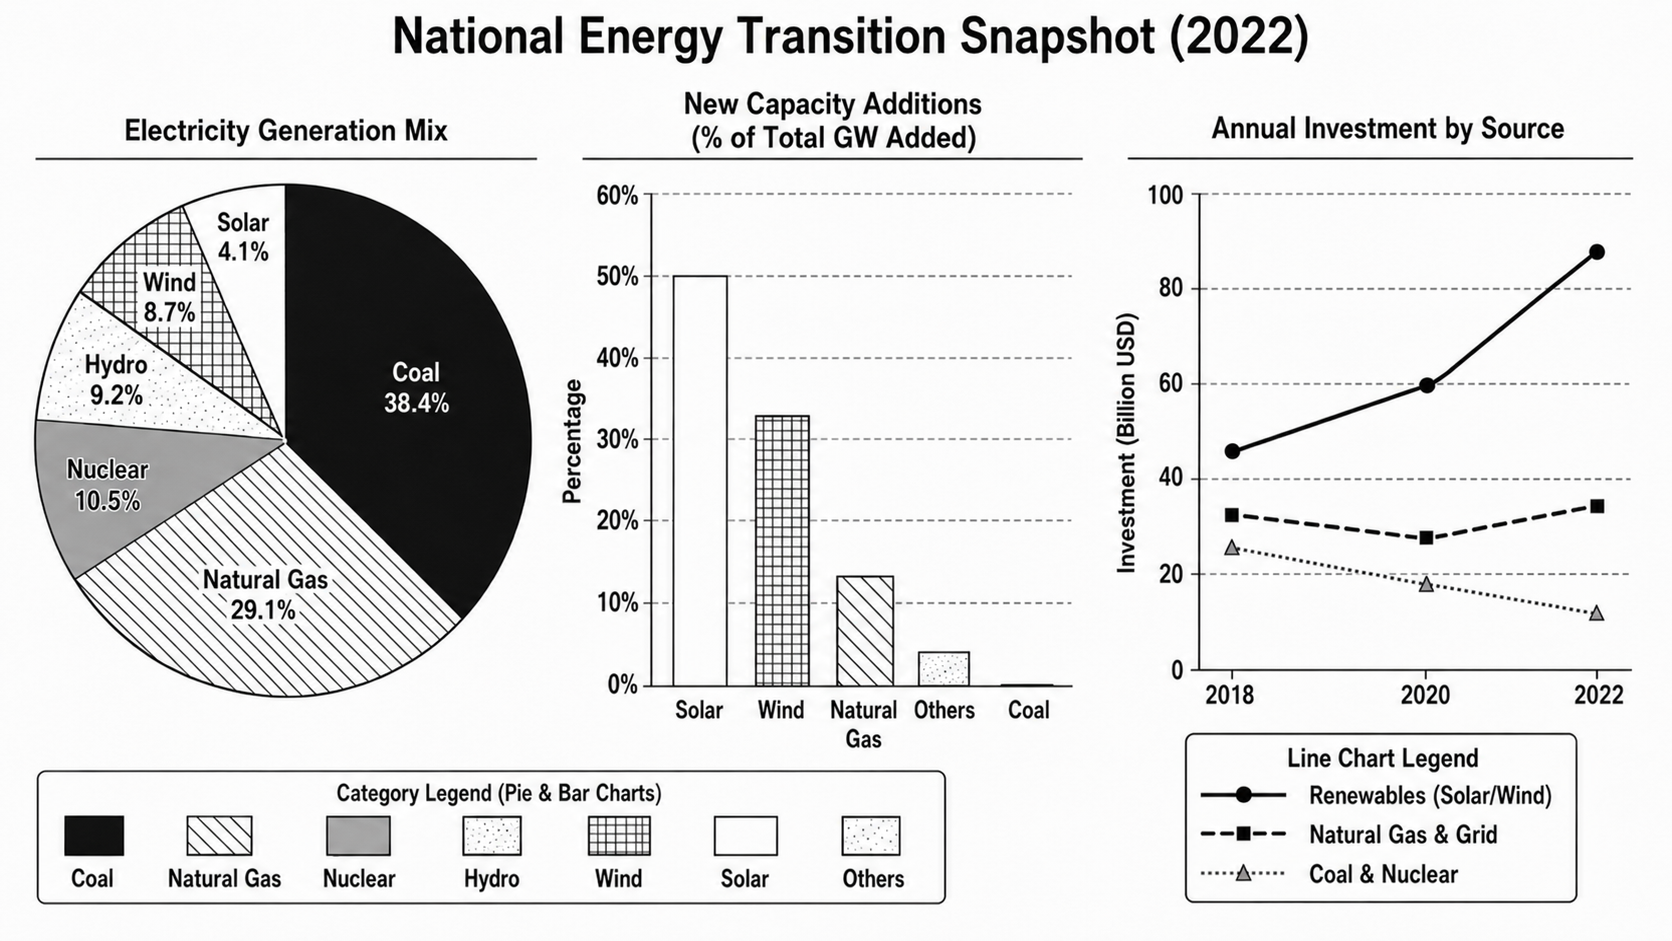
The charts below show a country’s electricity generation mix and the proportions of new generating capacity added from different energy sources in 2022, together with annual investment in three groups of energy sources from 2018 to 2022.
Summarise the information by selecting and reporting the main features, and make comparisons where relevant.
Want to see your estimated band score?
Check your writing scorePart 1 · Band 9 Sample Answer
The three charts depict a country’s energy transition through its electricity generation mix and new capacity additions in 2022, alongside investment trends for three energy groupings between 2018 and 2022.
Overall, the existing power system remained heavily reliant on fossil fuels, particularly coal and natural gas. However, renewables overwhelmingly dominated newly installed capacity, consistent with a sharp rise in investment in solar and wind. Meanwhile, spending on coal and nuclear power declined steadily.
Coal was the largest source of electricity generation in 2022, accounting for 38.4%, while natural gas supplied a further 29.1%. Together, therefore, fossil fuels produced over two thirds of national electricity. Nuclear energy represented 10.5%. The three renewable sources collectively contributed 22%, comprising 9.2% from hydropower, 8.7% from wind and only 4.1% from solar.
The pattern for capacity additions was markedly different. Solar alone constituted 50% of all gigawatts added, and wind made up another 33%. Natural gas accounted for approximately 13%, while other sources contributed 4%; no new coal capacity was recorded. Thus, solar had the smallest share of existing generation but the largest share of expansion.
Investment figures reinforce this shift. Funding for solar and wind rose from about $45 billion in 2018 to $60 billion in 2020, before accelerating to roughly $88 billion in 2022. By contrast, coal and nuclear investment fell from $25 billion to $18 billion and then $12 billion. Spending on natural gas and the grid dipped from approximately $32 billion to $27 billion before recovering to $34 billion, still far below renewable investment by 2022.
Part 1 · Band 8 Sample Answer
The charts provide information about a nation’s electricity sector, including the generation mix and proportions of new capacity added in 2022. They also show investment in renewables, natural gas and the grid, and coal and nuclear energy from 2018 to 2022.
Overall, coal and natural gas supplied most of the country’s electricity in 2022, but solar and wind were responsible for the great majority of new generating capacity. Investment also moved strongly towards renewables over the four-year period, while spending on coal and nuclear power decreased.
In the generation mix, coal ranked first at 38.4%, followed by natural gas at 29.1%. Nuclear power provided 10.5%. Renewable sources had smaller individual shares: hydropower represented 9.2%, wind 8.7% and solar 4.1%. Combined, these three renewables generated 22% of electricity, compared with 67.5% from coal and gas.
Solar nevertheless accounted for exactly half of all new capacity in 2022, despite being the smallest existing generation source. Wind contributed another 33%, meaning that the two together made up 83% of additions. Natural gas represented about 13%, other sources 4%, and coal had no share.
Renewable investment increased from approximately $45 billion in 2018 to $60 billion in 2020 and around $88 billion in 2022. In comparison, investment in coal and nuclear fell continuously, from $25 billion to $18 billion and finally $12 billion. Spending on natural gas and the grid followed a less consistent pattern, declining from about $32 billion to $27 billion before rising to roughly $34 billion in 2022.
Part 1 · Band 7 Sample Answer
The charts show the sources used to generate electricity in a country, the percentage of new capacity added in 2022 and changes in energy investment between 2018 and 2022.
Overall, coal and natural gas were still the main sources of electricity generation. However, most new capacity came from solar and wind power. Investment in these two renewable sources increased considerably, whereas the amount invested in coal and nuclear energy declined.
Coal produced 38.4% of the nation’s electricity in 2022, making it the largest source. Natural gas was second at 29.1%, so the two fossil fuels together accounted for 67.5%. Nuclear power supplied 10.5%. Among renewables, hydropower had the highest share at 9.2%, followed by wind at 8.7% and solar at only 4.1%.
The figures for newly added capacity were very different. Solar was responsible for 50% of the total, while wind provided a further 33%. Natural gas made up approximately 13%, and other sources represented the remaining 4%. There were no new additions from coal.
Investment in solar and wind rose from about $45 billion in 2018 to $60 billion in 2020. It then reached approximately $88 billion in 2022. By contrast, spending on coal and nuclear fell from $25 billion to $18 billion and finally $12 billion. Investment in natural gas and the grid decreased from around $32 billion in 2018 to $27 billion in 2020, before recovering slightly to about $34 billion in 2022.