ACADEMIC WRITING SAMPLE ANSWERS

Academic Writing Sample Answers Practice 10 Test 01

This original practice page includes Task 1 (Static Error Bar Chart) and Task 2 (Discuss Both Views and Give Your Opinion), with Band 9, Band 8, and Band 7 sample answers for IELTS preparation.
Academic Writing Task 1

Task 1 · Static Error Bar Chart

Task 1 Prompt

You should spend about 20 minutes on this task. Write at least 150 words.

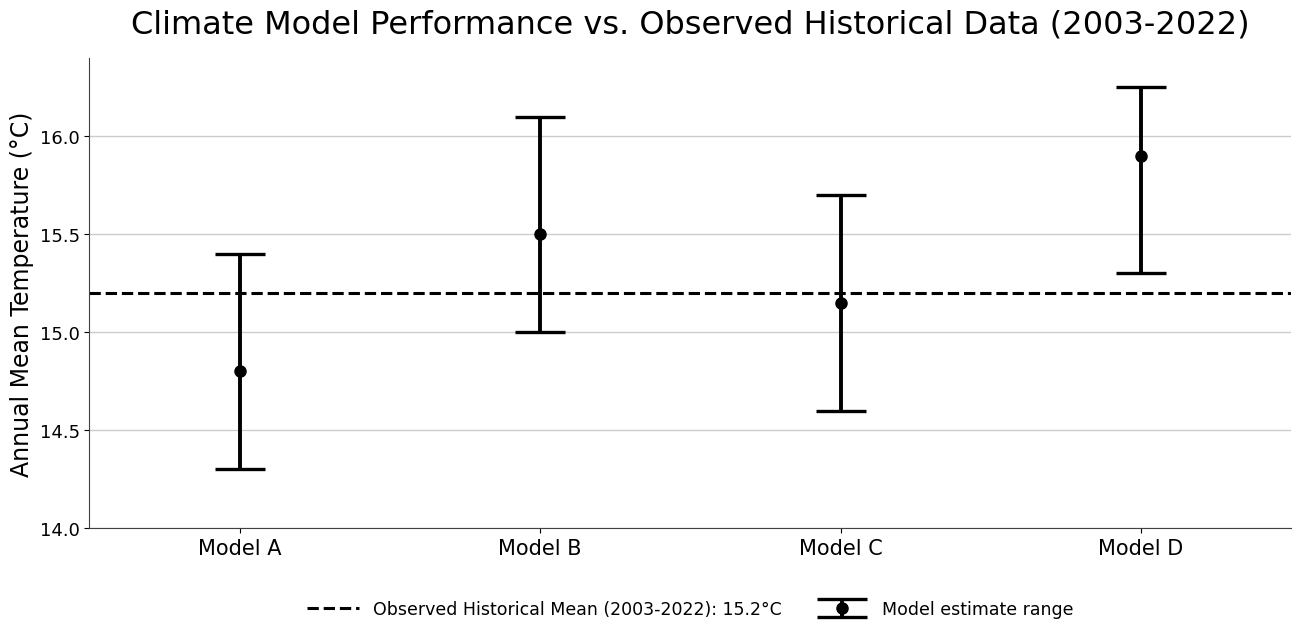
The chart below analyses the performance of four predictive climate models (A-D) against 20 years of observed historical data for annual mean temperature in a region, showing both the average projected temperature and the range of uncertainty for each model.

Summarise the information by selecting and reporting the main features, and make comparisons where relevant.
Academic Writing Task 1 Static Error Bar Chart practice image
BAND 9

Part 1 · Band 9 Sample Answer

The chart evaluates four climate models by comparing their estimates of annual mean temperature with the observed average for the period from 2003 to 2022. It also indicates the uncertainty surrounding each projection.

Overall, Model C produced the estimate closest to the historical mean of 15.2°C, whereas Model D projected the highest temperature and Model A the lowest. Although the uncertainty ranges of Models A, B and C all encompassed the observed figure, the entire range for Model D lay above it. The four intervals were broadly comparable in width, with that of Model D being slightly narrower.

Model A gave a central estimate of approximately 14.8°C, which was 0.4°C below the historical average. Its possible values extended from about 14.3°C to 15.4°C. Model C was considerably more accurate at the central point, estimating roughly 15.15°C. However, its uncertainty remained substantial, ranging between around 14.6°C and 15.7°C.

The other two models indicated warmer conditions than those historically recorded. Model B projected an average of 15.5°C, with lower and upper limits of 15.0°C and 16.1°C respectively. Model D showed the strongest warming projection, placing the mean at roughly 15.9°C. Its range began at about 15.3°C, already marginally above the observed average, and reached approximately 16.25°C. Thus, despite its relatively compact interval, Model D showed the clearest upward deviation from the historical benchmark.

BAND 8

Part 1 · Band 8 Sample Answer

The chart compares the performance of four climate models in estimating annual mean temperature, using the observed average between 2003 and 2022 as a benchmark. Both the central estimate and the uncertainty range are shown for each model.

Overall, the models produced noticeably different average estimates. Model D recorded the highest projected temperature, while Model A had the lowest. Model C was closest to the historical mean of 15.2°C. In addition, the observed figure fell within the ranges of the first three models, but not within that of Model D.

Model A estimated an annual temperature of around 14.8°C, or 0.4°C below the historical level. Its uncertainty interval was fairly wide, stretching from approximately 14.3°C to 15.4°C. Model C also had a broad range, from about 14.6°C to 15.7°C, although its central figure of roughly 15.15°C was almost identical to the actual historical mean.

By contrast, Models B and D both projected temperatures above the benchmark. The estimate for Model B stood at 15.5°C, and its range extended from 15.0°C to 16.1°C. Model D gave a substantially higher central projection of approximately 15.9°C. Even its lower limit, at around 15.3°C, exceeded the observed mean, while the upper limit reached roughly 16.25°C. Its uncertainty range was also slightly narrower than those associated with the other three models.

BAND 7

Part 1 · Band 7 Sample Answer

The chart shows how four climate models performed when their projections of annual mean temperature were compared with the observed average from 2003 to 2022. It presents an estimate and a range of possible values for each model.

Overall, Model D gave the highest estimate, whereas Model A produced the lowest. Model C was the closest to the historical mean of 15.2°C. The observed average was included within the uncertainty ranges for Models A, B and C, while the full range for Model D was above this level.

Model A predicted an average temperature of about 14.8°C. This was 0.4°C lower than the observed figure, and its range ran from roughly 14.3°C to 15.4°C. Model C estimated just under 15.2°C, making it the most accurate model based on the central value. However, its possible results varied considerably, from approximately 14.6°C to 15.7°C.

The other two estimates were higher than the historical average. Model B had a central value of 15.5°C, with a lower limit of 15.0°C and an upper limit of 16.1°C. Model D predicted around 15.9°C, the highest of all four figures. Its uncertainty interval was between about 15.3°C and 16.25°C, so even the lowest possible value remained above the historical mean. This interval was slightly narrower than the ranges shown for the other models.

Academic Writing Task 2

Task 2 · Discuss Both Views and Give Your Opinion

Task 2 Prompt

You should spend about 40 minutes on this task. Write at least 250 words.

Write about the following topic:

The proliferation of ‘smart city’ technologies—from widespread sensors and facial recognition to integrated data platforms—can improve urban efficiency and public safety. However, it also raises concerns about pervasive surveillance and the use of data for social control. Some argue that some loss of privacy is an inevitable and worthwhile trade-off for greater security and efficiency. Others believe that these technologies fundamentally undermine civil liberties and should be strictly limited, even at the cost of some operational benefits.

Discuss both views and give your own opinion.

Give reasons for your answer and include any relevant examples from your own knowledge or experience.

BAND 9

Part 2 · Band 9 Sample Answer

The attraction of smart-city technology is easy to understand: local authorities can use real-time information to manage transport, energy and policing with a speed that conventional administration cannot match. Yet the same infrastructure can record where people go, whom they meet and what they do. Although limited data collection may be justified for clearly defined public purposes, I do not accept that a general loss of privacy is either inevitable or a reasonable price for urban efficiency.

Supporters point first to practical improvements in daily life. Sensors can identify a leaking water main before serious damage occurs, adjust traffic lights when congestion builds and direct emergency services towards an incident more quickly. Integrated platforms can also reveal patterns that no single department would detect. Facial recognition, for example, might help locate a missing child or identify a dangerous suspect in a crowded station. From this perspective, refusing all such tools because they create some risk would sacrifice tangible public benefits. Privacy is also not absolute: societies already permit proportionate searches or camera use where a legitimate security need exists.

The opposing concern, however, is that smart-city systems make exceptional observation routine. A camera installed to manage traffic can later be connected to facial-recognition software, while data collected for planning can be shared with police or private contractors. Individuals may then be tracked without suspicion, meaningful consent or even awareness. This can discourage lawful activities such as attending a protest or visiting a sensitive medical service. More seriously, an integrated system could enable authorities to penalise people on the basis of their associations or behaviour. Even a well-intentioned government cannot guarantee that future officials, hackers or commercial partners will not misuse a permanent database.

In my view, cities should adopt useful technologies only under enforceable conditions of necessity and proportionality. Anonymous traffic counts require relatively light regulation, whereas facial identification in public spaces should need a specific legal basis, independent authorisation and evidence that less intrusive methods are inadequate. Data should be minimised, securely stored and deleted after a stated period, with public audits and genuine routes for appeal. Some projects will consequently become slower or less convenient, but that is an appropriate cost of preserving freedom.

Smart infrastructure should therefore serve residents rather than render them permanently observable. Efficiency and safety merit investment, but civil liberties must define the boundaries within which that investment operates.

BAND 8

Part 2 · Band 8 Sample Answer

Smart-city systems promise to make urban areas safer and easier to manage by collecting and combining large amounts of information. At the same time, technologies such as facial recognition can allow governments to monitor ordinary people on an unprecedented scale. I believe cities should use these tools where their benefits are clear, but privacy should not be treated as an unavoidable sacrifice.

Those willing to accept reduced privacy argue that data can improve both services and security. Road sensors can measure traffic flows and allow signals to respond immediately, reducing delays and unnecessary fuel use. Similar devices can detect faults in electricity or water networks before they become major emergencies. In public safety, connected cameras may help the police follow a violent offender or find a vulnerable missing person. Since urban authorities must make decisions affecting millions of residents, accurate real-time information can be more reliable than slow surveys or individual reports. Supporters therefore see some monitoring as a practical exchange for faster and better public services.

However, the collection of data creates dangers beyond an occasional breach of personal information. When cameras, travel records and administrative databases are linked, authorities may build detailed accounts of an individual’s movements and relationships. Facial-recognition errors could also cause innocent people to be questioned or denied access to services. Even if a system is introduced for crime prevention, its purpose may gradually expand to monitoring peaceful demonstrations or judging whether citizens behave in approved ways. People who know they are constantly watched may avoid lawful political or personal activities, weakening freedom of expression and association.

For these reasons, I favour controlled adoption rather than either unrestricted surveillance or a complete ban. Low-risk uses, such as anonymous sensors that count vehicles, should generally be allowed. Identifiable personal data should receive much stronger protection. Cities should explain what is collected, restrict its use to a stated purpose and delete it when it is no longer needed. Independent bodies should examine sensitive systems, and facial recognition should be used only for serious, specific cases rather than continuous tracking.

In conclusion, smart technology can produce genuine operational gains, but convenience alone cannot justify pervasive observation. Cities will remain both functional and free only if data collection is limited, transparent and open to challenge.

BAND 7

Part 2 · Band 7 Sample Answer

The growing use of sensors, cameras and shared data systems can help cities operate more efficiently and respond to crime. However, these tools can also reduce privacy and give authorities too much control over citizens. In my opinion, smart-city technology should be permitted, but only when clear rules protect personal information and prevent constant surveillance.

On the one hand, people may reasonably accept some loss of privacy in return for safer streets and improved services. Traffic sensors can show where congestion is developing, allowing a city to change signals or suggest other routes. Technology can also detect broken water pipes, monitor air quality and help emergency workers reach the correct place quickly. Cameras may provide useful evidence after a serious offence, while facial recognition could assist in finding a missing person. These examples show that collecting information is not always harmful and can solve problems more quickly than traditional methods.

On the other hand, the same systems can be used in ways that threaten basic freedoms. If cameras recognise every face and different databases are connected, the government may be able to follow a person throughout the day. Information collected for transport planning might later be used by the police or sold to a company without proper permission. There is also a risk of mistakes. A person wrongly identified by software could be treated as a suspect despite having done nothing illegal. Furthermore, citizens may become afraid to join a peaceful protest or express an unpopular opinion if they believe every action is being recorded.

I therefore believe the type of technology and its purpose should determine whether it is acceptable. Anonymous information about traffic or energy use is generally less dangerous and can be collected widely. By comparison, facial recognition should be restricted to serious investigations and should require independent approval. Authorities must tell the public what data they gather, keep it secure and delete it when the original purpose has been completed. People should also be able to challenge decisions made using automated systems.

In conclusion, giving up all urban technology would remove useful benefits, but accepting unlimited monitoring would be far more damaging. Smart cities should improve people’s lives without taking away the freedoms that make city life worth improving.

FREE PRACTICE RESOURCES

Download the IELTS Practice PDF Pack.

Get Listening, Reading, and Writing practice materials for self-study. Use a computer to download the 1.9GB pack.

Download PDF Pack
Chat History
My Notes