Task 1 · Static Bubble Chart
You should spend about 20 minutes on this task. Write at least 150 words.
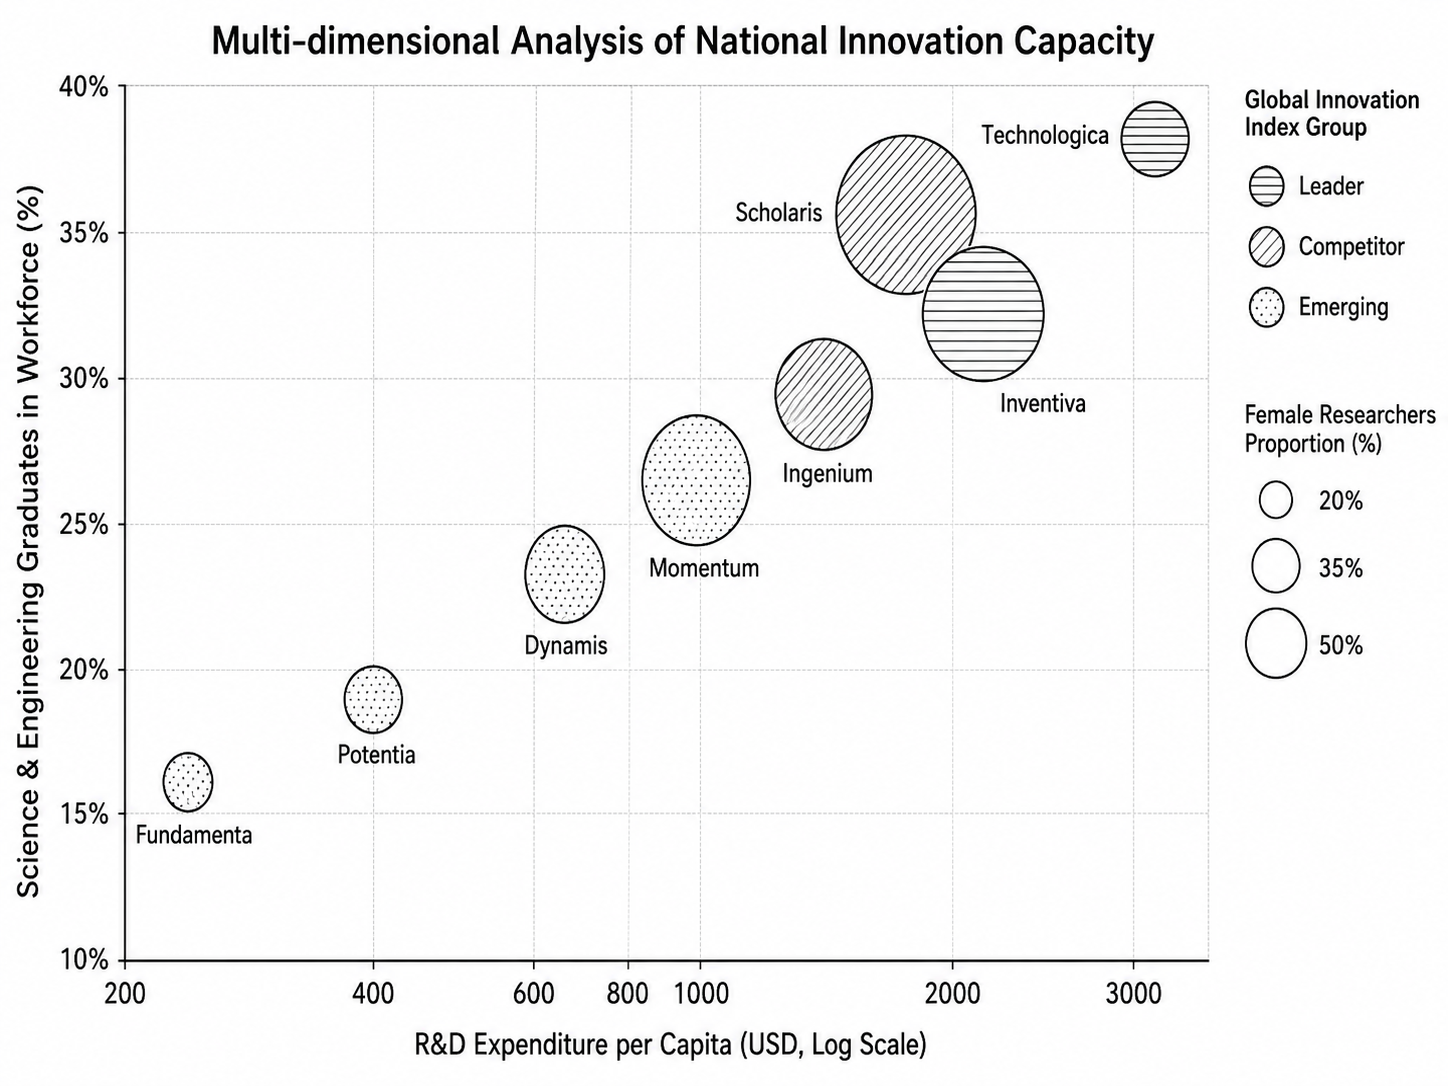
The chart below presents a multi-dimensional analysis of national innovation capacity for eight countries, correlating research and development (R&D) expenditure per capita, the percentage of science and engineering graduates in the workforce, and the proportion of female researchers, with each country's position in a global innovation index.
Summarise the information by selecting and reporting the main features, and make comparisons where relevant.
Want to see your estimated band score?
Check your writing scorePart 1 · Band 9 Sample Answer
The bubble chart compares eight countries by per-capita research and development spending and the share of science and engineering graduates in their workforces. Bubble size represents the proportion of female researchers, while the pattern denotes each country’s global innovation group.
Overall, greater R&D expenditure was closely associated with a larger technical workforce and a stronger innovation classification. Technologica ranked highest on both main measures, whereas Fundamenta recorded the lowest figures. Female representation, however, did not rise consistently with spending, reaching its highest level in Scholaris rather than in the leading investor.
The four emerging countries formed an upward sequence. Fundamenta spent about $250 per person and had a graduate share of 16%, compared with roughly $400 and 19% in Potentia. The figures increased to approximately $650 and 23% for Dynamis, then $1,000 and around 26.5% for Momentum. Their expanding bubbles also suggest progressively greater female participation.
Among the competitors, Ingenium allocated around $1,400 per capita to R&D, with technical graduates comprising just under 30% of its workforce. Scholaris spent approximately $1,800, while its graduate figure was markedly higher at about 35.5%. It also had the chart’s largest bubble, indicating that women accounted for roughly half of its researchers.
The two leaders both invested over $2,000 per person. Inventiva combined expenditure of around $2,200 with a graduate share of 32%, below Scholaris despite its greater spending. Technologica led decisively at approximately $3,200 and 38%, although its female-researcher proportion was more moderate than those of Scholaris and Inventiva.
Part 1 · Band 8 Sample Answer
The chart compares innovation capacity in eight countries using R&D expenditure per person and the percentage of science and engineering graduates in the workforce. Bubble size shows the share of female researchers, while its pattern identifies the country’s innovation-index group.
Overall, countries spending more on research generally had larger technical workforces and belonged to stronger innovation groups. Technologica was highest for both spending and graduate participation, while Fundamenta was lowest. However, female representation did not increase steadily with expenditure.
The four emerging countries followed a clear upward pattern. Fundamenta spent approximately $250 per capita and had 16% technical graduates. Potentia followed at around $400 and 19%, while Dynamis recorded roughly $650 and 23%. Momentum was the strongest in this group, with expenditure of about $1,000 and a graduate share of approximately 26.5%. Bubble sizes also increased across the group.
The competitors, Ingenium and Scholaris, occupied the middle-to-upper part of the chart. Ingenium spent around $1,400 per person, with technical graduates making up just under 30% of its workforce. Scholaris recorded about $1,800 and 35.5% respectively. Its bubble was the largest overall, showing that it also had the greatest female-researcher proportion.
Inventiva and Technologica were classified as leaders. Inventiva spent approximately $2,200 per capita, although its graduate share of around 32% was lower than that of Scholaris. Technologica had the highest figures, at about $3,200 and 38%. Nevertheless, its bubble was smaller than those of Scholaris and Inventiva.
Part 1 · Band 7 Sample Answer
The chart compares eight countries in terms of R&D spending per person and the percentage of science and engineering graduates in the workforce. Bubble size represents the proportion of female researchers, and the patterns divide the countries into leaders, competitors and emerging economies.
Overall, higher research spending was generally linked to a larger percentage of technical graduates and a better innovation position. Technologica had the highest values for both measures, while Fundamenta had the lowest. Female participation showed a less consistent pattern, with Scholaris having the largest bubble.
The four emerging countries appeared in the lower half of the chart. Fundamenta spent around $250 per person and had a graduate proportion of 16%. Potentia recorded about $400 and 19%, followed by Dynamis at approximately $650 and 23%. Momentum led this group, spending roughly $1,000 and having around 26.5% technical graduates. Its female-researcher proportion was also much greater than that of Fundamenta.
The two competitors were Ingenium and Scholaris. Ingenium had R&D spending of about $1,400 and a graduate share just below 30%. Scholaris recorded higher figures of approximately $1,800 and 35.5%. It also had the largest bubble, indicating the highest proportion of female researchers.
Finally, Inventiva and Technologica were the two innovation leaders. Inventiva spent about $2,200 per person and had around 32% technical graduates. Technologica ranked first overall, with roughly $3,200 in spending and a graduate figure of 38%. However, its female-researcher share was lower than those of Scholaris and Inventiva.