Task 1 · Static Bubble Chart
You should spend about 20 minutes on this task. Write at least 150 words.
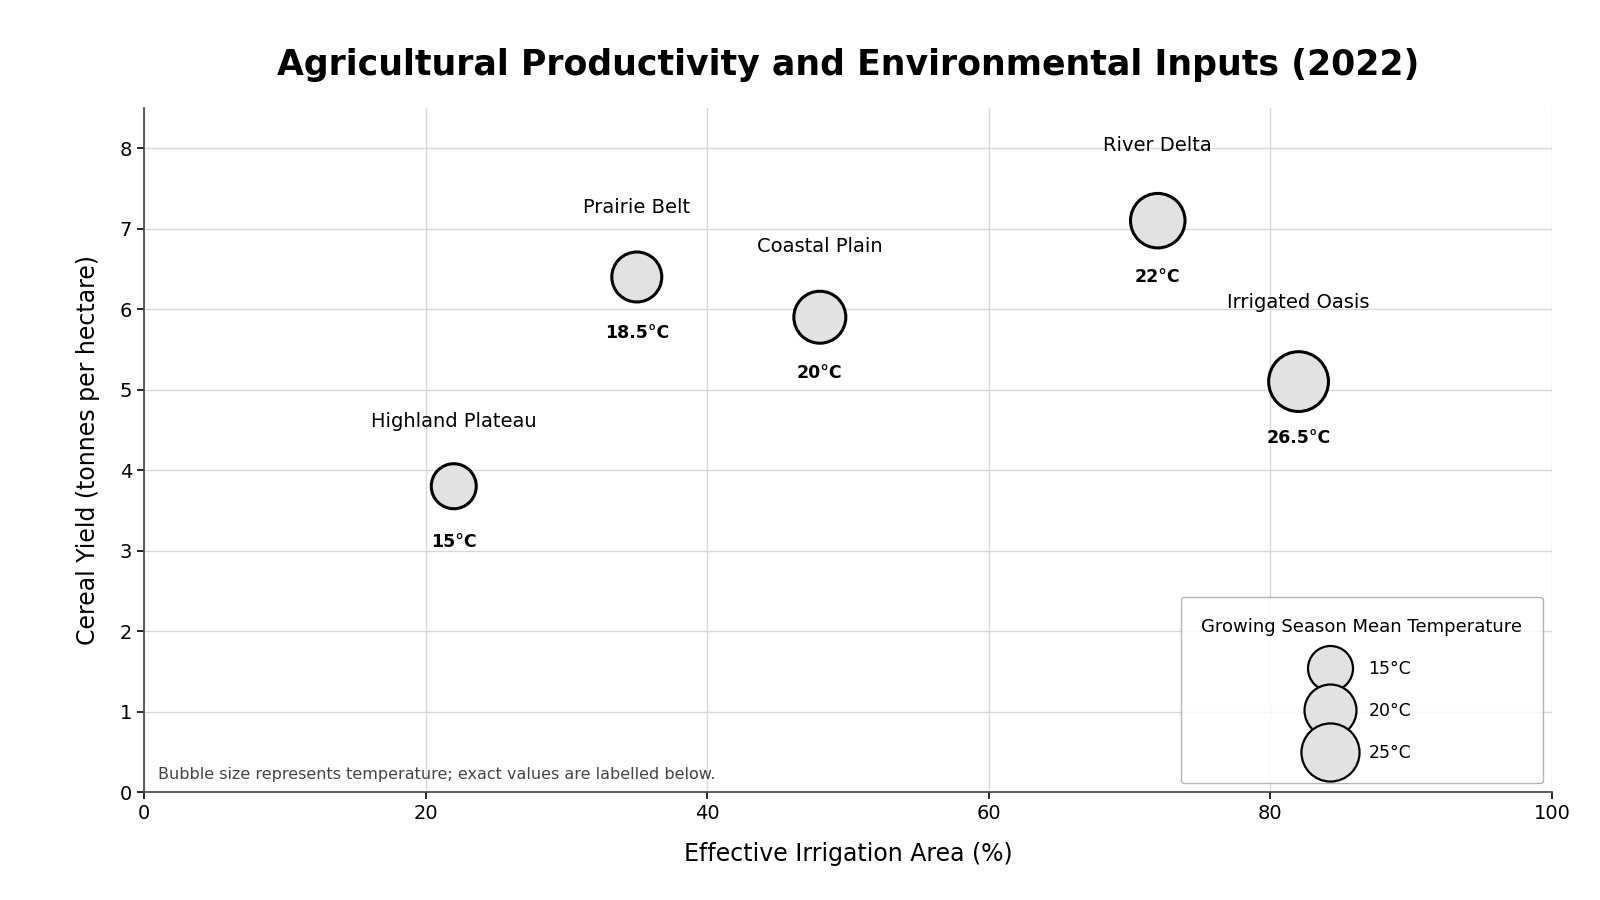
The chart below presents a multi-variable analysis of the relationship between agricultural productivity (cereal yield per hectare) and key environmental inputs across five major food-producing regions in the 2022 growing season.
Summarise the information by selecting and reporting the main features, and make comparisons where relevant.
Want to see your estimated band score?
Check your writing scorePart 1 · Band 9 Sample Answer
The bubble chart examines five food-producing regions during the 2022 growing season, comparing cereal yield with the proportion of land under effective irrigation. Bubble size represents mean temperature, with the precise temperature also stated for each region.
Overall, irrigation coverage and temperature broadly increased together across the five regions, but neither variable had a consistently positive relationship with cereal productivity. The River Delta achieved the highest yield, while the Highland Plateau recorded the lowest. Notably, the Irrigated Oasis had both the greatest irrigation coverage and the warmest conditions, yet its yield was only the second lowest.
At the lower end, approximately 22% of the Highland Plateau was effectively irrigated, and this region produced about 3.8 tonnes per hectare at 15°C. The Prairie Belt, with irrigation coverage of roughly 35%, recorded a substantially higher yield of 6.4 tonnes per hectare. Its mean temperature was also higher, at 18.5°C.
The Coastal Plain had around 48% of its area effectively irrigated and an average temperature of 20°C. Nevertheless, its cereal yield, at just under 6 tonnes per hectare, was below that of the less irrigated Prairie Belt. The River Delta performed best overall, producing approximately 7.1 tonnes per hectare from irrigation coverage of about 72% under a mean temperature of 22°C.
By contrast, the Irrigated Oasis combined the highest irrigation figure, at roughly 82%, with the highest temperature of 26.5°C. Despite these levels, it yielded only around 5.1 tonnes per hectare, considerably less than the River Delta and both middle-ranking regions.
Part 1 · Band 8 Sample Answer
The chart compares five major agricultural regions in 2022 according to cereal yield per hectare and the percentage of land with effective irrigation. The bubbles represent growing-season mean temperature, and exact temperature figures are provided.
Overall, the River Delta produced the greatest cereal yield, whereas the Highland Plateau had the lowest. Although regions with more irrigation generally experienced higher temperatures, greater irrigation coverage did not always result in higher output. In particular, the Irrigated Oasis ranked first for irrigation and temperature but only fourth for yield.
The Highland Plateau had the smallest effectively irrigated area, at approximately 22%, and produced around 3.8 tonnes per hectare. It was also the coolest region, with a mean temperature of 15°C. The Prairie Belt recorded roughly 35% irrigation and a much higher yield of 6.4 tonnes per hectare at 18.5°C.
The Coastal Plain was warmer, at 20°C, and almost half of its area was effectively irrigated. However, its yield of about 5.9 tonnes per hectare was lower than that of the Prairie Belt. The River Delta achieved the highest output, at roughly 7.1 tonnes per hectare, with irrigation coverage of around 72% and a mean temperature of 22°C.
Finally, the Irrigated Oasis had effective irrigation across approximately 82% of its area. Its temperature was also the highest, at 26.5°C. Nevertheless, it produced only about 5.1 tonnes of cereal per hectare, exceeding only the figure for the Highland Plateau.
Part 1 · Band 7 Sample Answer
The chart shows cereal production and environmental conditions in five regions during the 2022 growing season. It compares yield per hectare with the percentage of effective irrigation area, while the bubbles and labels show average temperature.
Overall, the River Delta had the highest cereal yield, and the Highland Plateau had the lowest. Regions with more irrigation generally had higher temperatures. However, yield did not rise regularly with irrigation, because the Irrigated Oasis had the highest irrigation percentage but a relatively low output.
The Highland Plateau had around 22% effective irrigation and produced approximately 3.8 tonnes per hectare. Its mean temperature was 15°C, the lowest shown. The Prairie Belt had a higher irrigation figure of about 35% and a temperature of 18.5°C. Its cereal yield was roughly 6.4 tonnes per hectare, making it the second most productive region.
In the Coastal Plain, almost 50% of the area was effectively irrigated. The temperature was 20°C, while the yield stood at just under 6 tonnes per hectare. The River Delta had about 72% irrigation and a mean temperature of 22°C. It produced approximately 7.1 tonnes per hectare, the highest result on the chart.
The Irrigated Oasis recorded the highest irrigation level, at roughly 82%, and it was also the warmest region at 26.5°C. Despite this, its yield was only around 5.1 tonnes per hectare. This was higher than the Highland Plateau figure but lower than the results for the other three regions.