Task 1 · Static Mixed Chart
You should spend about 20 minutes on this task. Write at least 150 words.
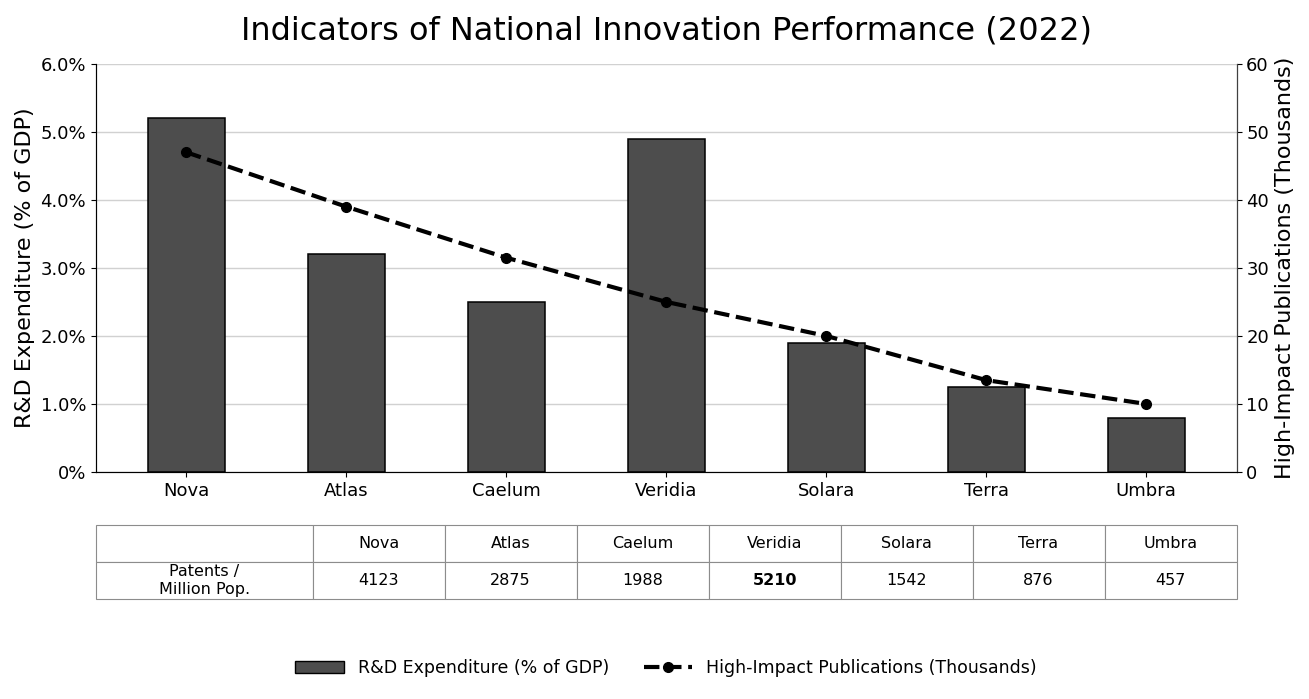
The chart and table below compare national investment in research and development (R&D) as a percentage of GDP, the annual output of high-impact research publications, and the number of domestic patent applications filed per million people in seven selected countries in 2022.
Summarise the information by selecting and reporting the main features, and make comparisons where relevant.
Want to see your estimated band score?
Check your writing scorePart 1 · Band 9 Sample Answer
The chart and accompanying table compare seven countries in 2022 in terms of expenditure on research and development as a share of GDP, high-impact publications produced annually, and patent applications per million inhabitants.
Overall, Nova led both R&D spending and research publications, whereas Veridia recorded the greatest patent intensity. At the opposite end, Umbra ranked last on every measure. Although publication output generally fell in line with R&D expenditure, Veridia was a notable exception, combining the second-highest spending rate with only the fourth-largest publication total.
Nova devoted 5.2% of GDP to R&D and generated approximately 47,000 high-impact papers, the highest figures shown. Veridia’s expenditure was only slightly lower, at 4.9%, but its publication output stood at roughly 25,000. By comparison, Atlas invested 3.2% and produced about 39,000 publications, while Caelum, at 2.5%, generated just over 30,000. Thus, both countries published considerably more influential research than Veridia despite allocating smaller proportions of GDP.
Among the three lower-investment countries, Solara spent 1.9% and published 20,000 papers, followed by Terra at around 1.2% and 14,000, and Umbra at 0.8% and 10,000. Patent applications presented a somewhat different order. Veridia topped the table with 5,210 per million people, ahead of Nova’s 4,123. Atlas and Caelum registered 2,875 and 1,988 respectively, while the totals declined to 1,542 in Solara, 876 in Terra and just 457 in Umbra.
Part 1 · Band 8 Sample Answer
The graphic compares seven nations according to three measures of innovation in 2022: R&D expenditure as a proportion of GDP, annual high-impact publications and patent applications per million residents.
Overall, Nova and Veridia spent the largest shares of GDP on research, while Nova also produced the most high-impact publications. However, Veridia, rather than Nova, had the highest rate of patent applications. Umbra had the lowest result for all three indicators.
Nova invested 5.2% of GDP in R&D, marginally more than Veridia at 4.9%. The next highest figure was 3.2% in Atlas, followed by Caelum at 2.5%. Spending was below 2% in the remaining countries: 1.9% in Solara, about 1.2% in Terra and only 0.8% in Umbra.
Publication output followed a steady downward pattern from Nova to Umbra. Nova produced around 47,000 high-impact publications, compared with 39,000 in Atlas and approximately 31,000 in Caelum. Veridia generated 25,000, despite its high level of investment, while the figures for Solara, Terra and Umbra were 20,000, roughly 14,000 and 10,000 respectively.
For patents, Veridia ranked first with 5,210 applications per million people, followed by Nova with 4,123. Atlas recorded 2,875, and Caelum and Solara had 1,988 and 1,542. Much lower rates were seen in Terra, at 876, and Umbra, at 457.
Part 1 · Band 7 Sample Answer
The chart shows R&D spending and the number of high-impact research publications in seven countries in 2022, while the table gives their domestic patent applications per million people.
Overall, Nova performed best in expenditure and publications, although Veridia had the largest number of patent applications. Umbra was the weakest country across all three categories. In general, countries with higher research spending also had more publications and patents, but Veridia did not follow the publication pattern.
Nova spent 5.2% of its GDP on R&D, and its annual publication total was approximately 47,000. Veridia invested a similar share, at 4.9%, but produced only about 25,000 high-impact papers. Atlas spent 3.2% and published 39,000 papers, while Caelum’s figures were 2.5% and just over 30,000. Solara was lower on both measures, with 1.9% and 20,000 publications. Terra invested around 1.2% and produced roughly 14,000 papers, compared with only 0.8% and 10,000 in Umbra.
The patent figures show a slightly different ranking. Veridia received the highest figure, at 5,210 applications per million population, while Nova came second with 4,123. Atlas had 2,875 applications, followed by Caelum at 1,988 and Solara at 1,542. The two smallest numbers were recorded in Terra and Umbra, with 876 and 457 applications per million respectively.