Task 1 · Static Mixed Chart
You should spend about 20 minutes on this task. Write at least 150 words.
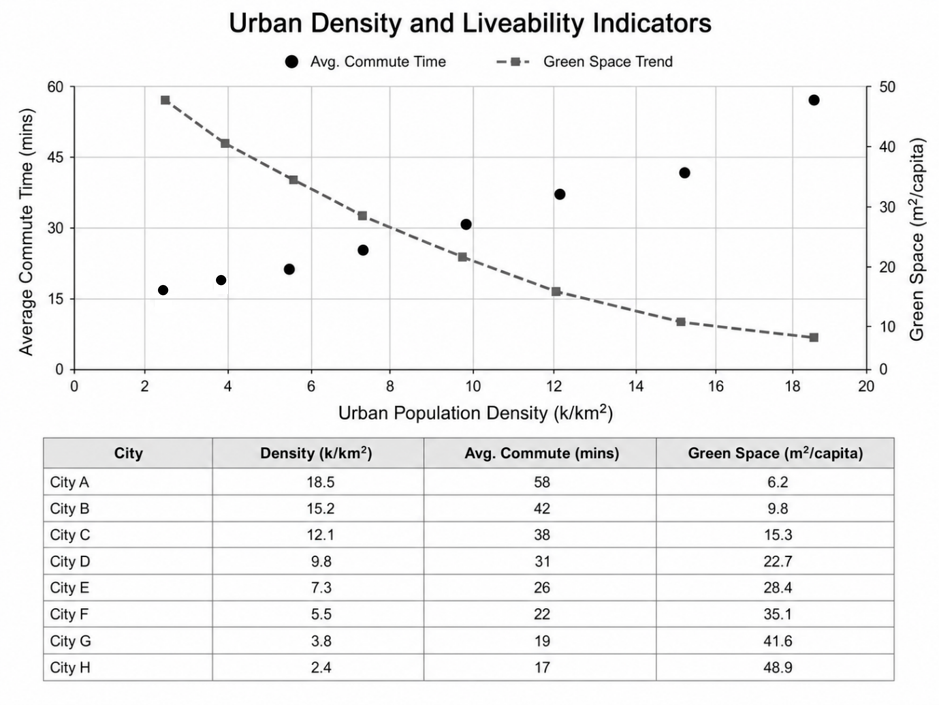
The graph and table below show the relationships between urban population density, measured in thousands of persons per square kilometre, and two key indicators of urban liveability—average commute time and accessible green space per capita—across eight major global cities.
Summarise the information by selecting and reporting the main features, and make comparisons where relevant.
Want to see your estimated band score?
Check your writing scorePart 1 · Band 9 Sample Answer
The graph plots eight cities by population density and average commuting time, while also tracing changes in accessible green space. The accompanying table provides the precise figures for all three measures.
Overall, the data reveal two consistent relationships: denser cities tend to have longer commutes but substantially less green space per resident. City A occupies the least favourable extreme on both liveability indicators, whereas the sparsely populated City H records the shortest journey and the greatest provision of greenery.
Among the three least dense locations, City H has 2,400 inhabitants per square kilometre, a commute of 17 minutes and 48.9 square metres of green space per person. Density then rises to 3,800 in City G and 5,500 in City F; their corresponding travel times increase modestly to 19 and 22 minutes, while green space falls to 41.6 and 35.1 square metres respectively.
The same pattern continues across the middle of the range. City E, at 7,300 people per square kilometre, offers 28.4 square metres of greenery and has a 26-minute commute. The figures for City D are 9,800, 22.7 square metres and 31 minutes, while City C combines a density of 12,100 with 15.3 square metres and a 38-minute journey.
At the upper end, City B has 15,200 residents per square kilometre, 9.8 square metres of green space and a 42-minute commute. City A is denser still, at 18,500, and its journey time rises sharply to 58 minutes, while greenery contracts to just 6.2 square metres per capita.
Part 1 · Band 8 Sample Answer
The graph and table compare population density with commuting time and green space per person in eight cities.
Overall, commute times become longer as population density rises, whereas the amount of green space moves in the opposite direction. City A is the densest city and has both the longest commute and the smallest green area per resident. City H shows the reverse pattern.
City H has a density of 2,400 people per square kilometre. Its residents commute for an average of 17 minutes and have access to 48.9 square metres of green space each. The next two cities, G and F, are denser at 3,800 and 5,500 people per square kilometre. Their journey times are slightly higher, at 19 and 22 minutes, while green space falls to 41.6 and 35.1 square metres.
In the middle group, City E records a density of 7,300, a commute of 26 minutes and 28.4 square metres of greenery per capita. City D has 9,800 residents per square kilometre and a 31-minute journey, together with 22.7 square metres of green space. In City C, these figures change further to 12,100 people, 38 minutes and 15.3 square metres respectively.
The two highest-density cities have the poorest green-space provision. City B, with 15,200 people per square kilometre, provides 9.8 square metres per person and has an average commute of 42 minutes. City A reaches 18,500 people per square kilometre, while its commute rises to 58 minutes and its green space drops to 6.2 square metres.
Part 1 · Band 7 Sample Answer
The graph shows the connection between population density and average commute time in eight cities, while the table also gives the amount of accessible green space per person.
Overall, cities with a higher population density have longer commuting times and less green space. City A has the highest density and the least positive results for both liveability measures. By contrast, City H is the least crowded, with the shortest commute and most green space.
City H has 2,400 people per square kilometre, and the average journey to work takes 17 minutes. It also provides 48.9 square metres of green space per person. In City G, density increases to 3,800 and the commute is 19 minutes, while green space falls to 41.6 square metres. City F follows the same trend, with figures of 5,500 people, 22 minutes and 35.1 square metres respectively.
The three middle cities are E, D and C. Their population densities rise from 7,300 to 9,800 and then 12,100 people per square kilometre. At the same time, commuting increases from 26 to 31 and 38 minutes. Green space drops steadily from 28.4 square metres in City E to 22.7 in City D and 15.3 in City C.
City B is the second-densest location, at 15,200 people per square kilometre. It has a 42-minute average commute and 9.8 square metres of green space. Finally, City A has a density of 18,500, a much longer journey of 58 minutes and only 6.2 square metres of greenery per resident.