Task 1 · Static Grouped Bar Chart
You should spend about 20 minutes on this task. Write at least 150 words.
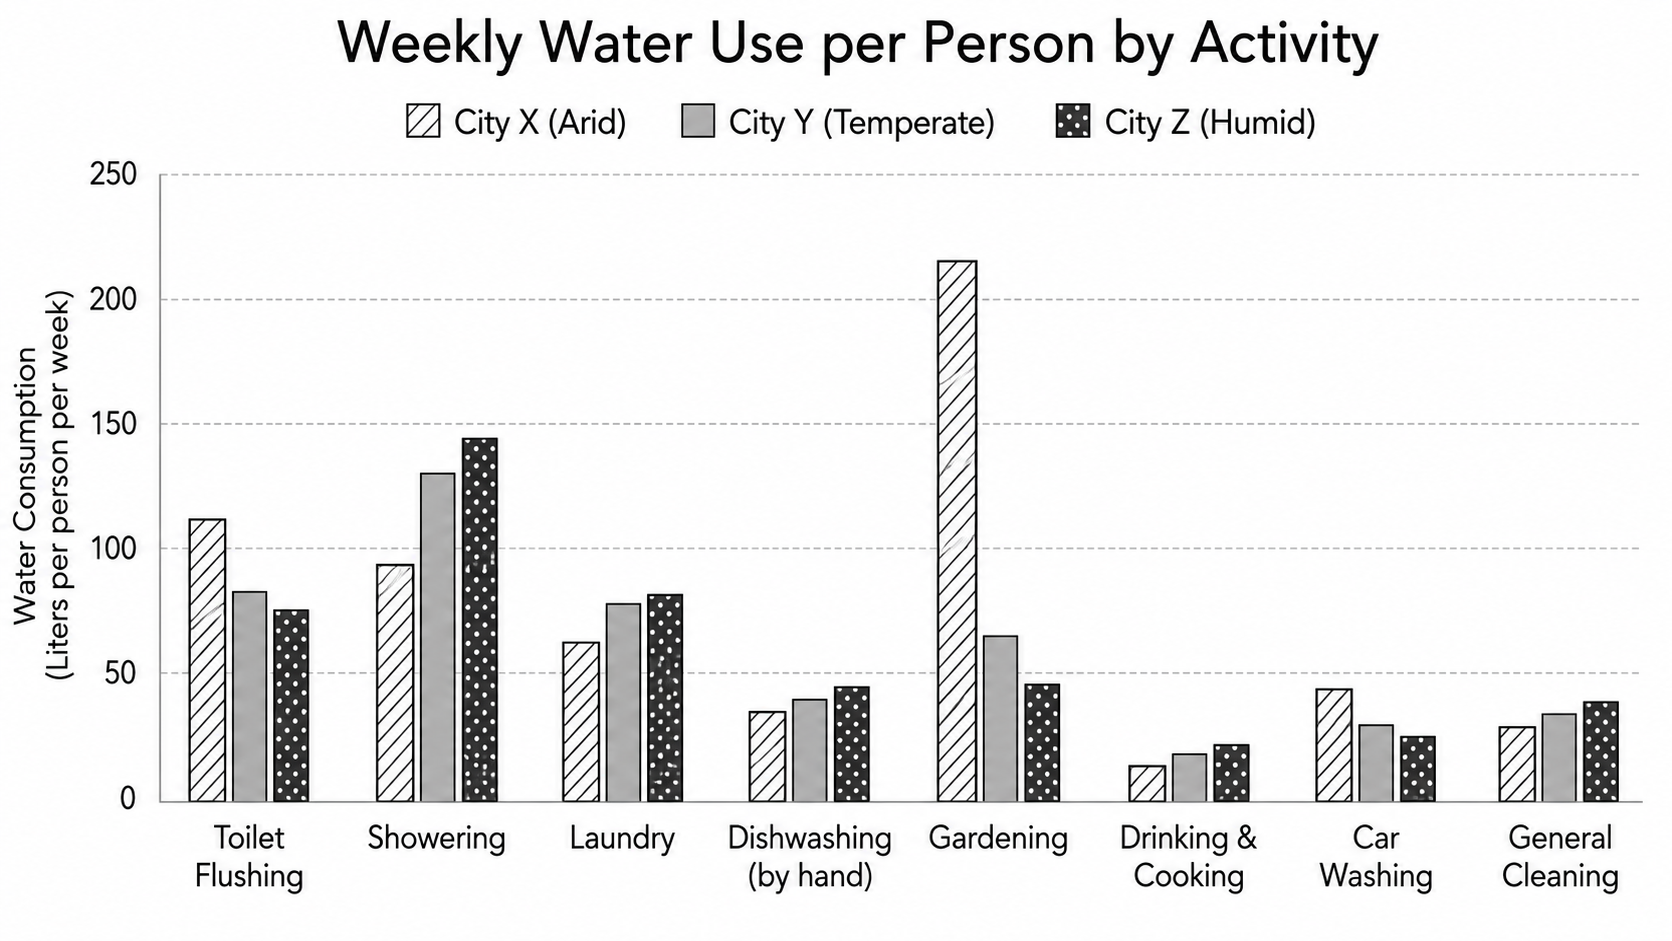
The chart below shows the comparative weekly water consumption (in liters per person) for eight common household activities across three cities with different climate conditions.
Summarise the information by selecting and reporting the main features, and make comparisons where relevant.
Want to see your estimated band score?
Check your writing scorePart 1 · Band 9 Sample Answer
The chart compares weekly per-person water use for eight domestic purposes in three cities with different climates.
Overall, City Y occupied the middle position for every activity. City X, which has an arid climate, recorded the greatest consumption for toilet flushing, gardening and car washing, whereas humid City Z led in all five remaining categories. Gardening in City X was by far the largest figure and also showed the widest gap between cities, while drinking and cooking required the least water everywhere.
In City X, gardening consumed approximately 215 litres per person each week, over three times City Y’s figure of around 65 litres and almost five times the 45 litres used in City Z. The arid city also used about 110 litres for flushing toilets, compared with roughly 82 and 75 litres in Cities Y and Z respectively. Car washing followed the same order, declining from approximately 43 litres in City X to 30 in City Y and 25 in City Z.
The opposite pattern applied to the other activities. Showering rose sharply from just over 90 litres in City X to 130 in City Y and about 145 in City Z, making it the leading use in the latter two locations. Laundry figures were closer, at approximately 62, 77 and 82 litres respectively. Smaller increases across the three cities can be seen for hand dishwashing, from about 35 to 44 litres; drinking and cooking, from roughly 12 to 22; and general cleaning, from around 28 to 40 litres.
Part 1 · Band 8 Sample Answer
The chart compares weekly water use per person for eight household activities across cities with arid, temperate and humid climates.
Overall, the temperate city recorded an intermediate amount for every use. Residents of arid City X used much more water for gardening and somewhat more for toilet flushing and car washing. By contrast, humid City Z had the highest figures for showering, laundry, dishwashing, drinking and cooking, and general cleaning.
Gardening was the most striking category. Consumption reached about 215 litres per person in City X, but was only around 65 litres in City Y and 45 litres in City Z. Toilet flushing showed a less dramatic version of the same pattern, with approximately 110 litres used in the arid city, compared with just over 80 in the temperate location and 75 in the humid one. The corresponding figures for washing cars were roughly 43, 30 and 25 litres.
For showering, the order was reversed. City Z used about 145 litres per person, ahead of City Y at 130 litres and City X at just over 90. Laundry consumption also increased across these cities, from approximately 62 litres in City X to almost 80 in City Y and just above 80 in City Z. The remaining uses involved smaller quantities. Hand dishwashing ranged from around 35 to 44 litres, while general cleaning rose from about 28 litres in City X to 40 in City Z. Drinking and cooking had the lowest figures, at roughly 12, 18 and 22 litres respectively.
Part 1 · Band 7 Sample Answer
The chart compares weekly per-person water use for eight activities in three cities with different climate conditions.
Overall, City X used the most water for gardening, toilet flushing and car washing. City Z had the highest consumption in the other five categories, while City Y was in the middle for every activity. Gardening in City X was the largest figure on the chart, whereas drinking and cooking used the least water in all three places.
People in City X used about 215 litres per week for gardening. This was much higher than the figures of approximately 65 litres in City Y and 45 litres in City Z. Toilet flushing showed the same order, at around 110, 82 and 75 litres respectively. Water used for car washing also fell from roughly 43 litres in City X to 30 litres in City Y and 25 litres in City Z.
For showering, City Z recorded the highest amount, at about 145 litres, followed by City Y at 130 litres and City X at just over 90 litres. Laundry use was approximately 62 litres in City X, 77 in City Y and 82 in City Z. The differences were smaller for the remaining activities. Hand dishwashing increased from about 35 to 44 litres across the three cities, while general cleaning rose from around 28 to 40 litres. Finally, drinking and cooking accounted for only about 12, 18 and 22 litres respectively.