Task 1 · Dynamic Mixed Chart
You should spend about 20 minutes on this task. Write at least 150 words.
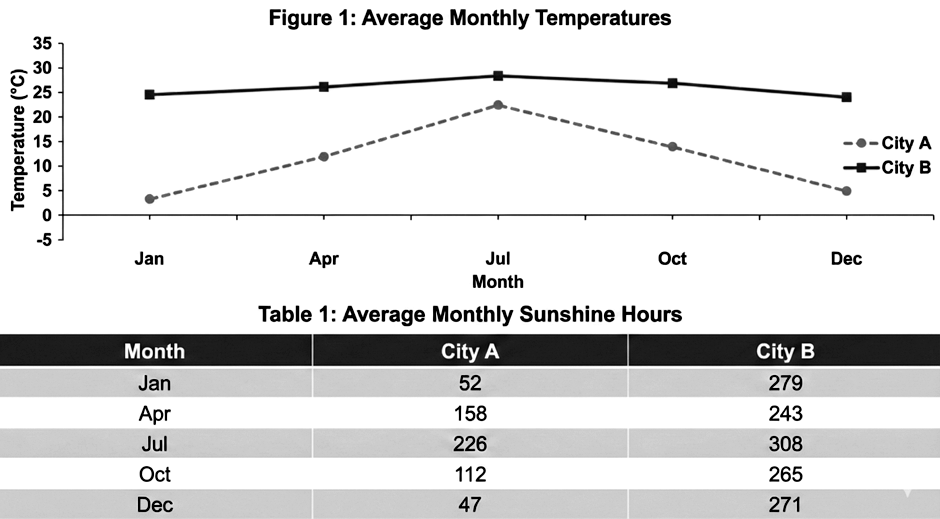
The line graph and table below show the average monthly temperatures and average monthly sunshine hours in two different cities, City A and City B, for five selected months of a year.
Summarise the information by selecting and reporting the main features, and make comparisons where relevant.
Want to see your estimated band score?
Check your writing scorePart 1 · Band 9 Sample Answer
The line graph compares average temperatures in City A and City B in five months, while the table gives their monthly sunshine totals.
Overall, City B is warmer and receives substantially more sunshine than City A throughout. Temperatures in both places peak in July before declining, although City A experiences far greater seasonal variation. Sunshine in City A likewise rises to a July maximum and then falls sharply, whereas City B’s total remains comparatively high.
In January, City A records only about 3°C, compared with approximately 24°C in City B. By July, both cities reach their warmest point, at roughly 22°C and 28°C respectively. City A then cools considerably to about 14°C in October and 5°C in December. City B follows a gentler downward trend, slipping from around 27°C to 24°C over the same two months. In April, the respective temperatures are approximately 12°C and 26°C.
A similar seasonal pattern is evident in City A’s sunshine totals, which climb from 52 hours in January to 158 in April and a peak of 226 in July. They subsequently drop to 112 hours in October and just 47 in December. City B, by contrast, receives between 243 and 308 hours in every month shown. Its lowest total occurs in April, while its July peak exceeds City A’s figure by 82 hours. Even in December, City B enjoys 271 hours of sunshine, almost six times City A’s total.
Part 1 · Band 8 Sample Answer
The graph illustrates average monthly temperatures in two cities during five selected months, and the table compares the amount of sunshine they receive.
Overall, City B is much warmer and sunnier than City A in every month presented. Both cities are hottest in July, but temperatures vary more markedly in City A. City A’s sunshine total also changes considerably, while City B records relatively high figures throughout.
City A begins at approximately 3°C in January. Its temperature then increases to about 12°C in April and reaches roughly 22°C in July. Afterwards, the figure falls to around 14°C in October and 5°C in December. By comparison, City B has a much narrower temperature range. It warms gradually from about 24°C in January to 26°C in April and 28°C in July, before decreasing slightly to 27°C in October and 24°C at the end of the year.
Regarding sunshine, City A receives 52 hours in January, but this total triples to 158 hours in April and then peaks at 226 in July. It subsequently drops to 112 hours in October and reaches its lowest point, 47 hours, in December. Totals in City B fall from 279 hours in January to 243 in April, climb to a maximum of 308 in July, and then decline to 265 in October before recovering to 271 in December. The gap between the cities is widest in December, at 224 hours, and narrowest in July, at 82 hours.
Part 1 · Band 7 Sample Answer
The line graph shows the average temperatures of City A and City B in five months, while the table provides information about their average sunshine hours.
Overall, City B is warmer than City A throughout, and it also has more sunshine in every month. July is the hottest month in both cities. However, City A shows much larger changes in both temperature and sunshine.
In City A, the average temperature is about 3°C in January. It rises to around 12°C in April and then reaches approximately 22°C in July. The figure falls afterwards, to about 14°C in October and 5°C in December. City B has higher but more stable temperatures. Its figure increases from roughly 24°C in January to 26°C in April and 28°C in July. It then drops slightly to around 27°C in October and returns to 24°C in December.
City A receives 52 hours of sunshine in January. This total rises to 158 hours in April and reaches its highest level of 226 hours in July. It then decreases sharply to 112 hours in October and only 47 hours in December. In contrast, City B records 279 sunshine hours in January. Although this falls to 243 in April, it rises to a peak of 308 in July. The figure then decreases to 265 hours in October before increasing slightly to 271 hours in December. Thus, the difference in sunshine is especially large at the end of the year.