Task 1 · Static Table
You should spend about 20 minutes on this task. Write at least 150 words.
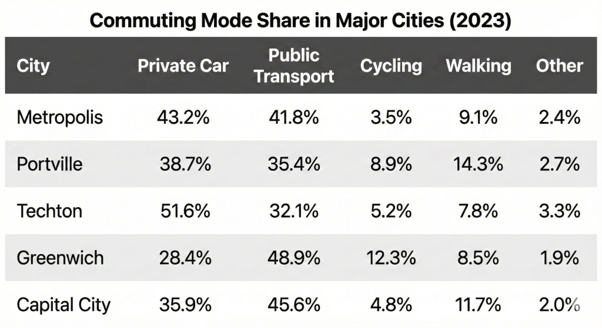
The table below presents data on the percentage of people using different modes of transport to commute to work in five major cities in 2023.
Summarise the information by selecting and reporting the main features, and make comparisons where relevant.
Want to see your estimated band score?
Check your writing scorePart 1 · Band 9 Sample Answer
The table compares the proportions of workers commuting by five different means of transport in five large cities in 2023.
Overall, private cars and public transport together accounted for the vast majority of journeys in every city. Cars were the leading mode in Metropolis, Portville and Techton, whereas public transport ranked first in Greenwich and Capital City. Other forms of transport had the smallest share throughout.
Techton was the most car-dependent city, with 51.6% of commuters driving, while its public transport figure was 32.1%. Metropolis showed a far more even division between these two modes, at 43.2% and 41.8% respectively. Cars also led in Portville, although the difference was relatively modest: 38.7% travelled by car compared with 35.4% using public transport. By contrast, Greenwich recorded the lowest proportion of motorists, at 28.4%, and the highest use of public transport, at 48.9%. Capital City followed a similar pattern, with respective shares of 35.9% and 45.6%.
Active travel was less common but varied noticeably. Greenwich had the highest cycling rate, at 12.3%, followed by Portville at 8.9%; Metropolis had the lowest, at 3.5%. Walking peaked in Portville at 14.3%, ahead of Capital City’s 11.7%, while Techton had the smallest share at 7.8%. Finally, the “other” category represented only 1.9% to 3.3% of commuters, with the minimum in Greenwich and the maximum in Techton.
Part 1 · Band 8 Sample Answer
The table shows the percentages of commuters who used five modes of transport in Metropolis, Portville, Techton, Greenwich and Capital City in 2023.
Overall, travelling by private car or public transport was much more common than cycling, walking or using other means. Private cars were the most popular choice in three cities, while public transport had the largest share in Greenwich and Capital City. The “other” category was the least used option in all five locations.
Private car use was highest in Techton, where it accounted for 51.6% of commuters. The figures were lower in Metropolis and Portville, at 43.2% and 38.7% respectively, although cars still ranked first in both cities. Greenwich had the lowest car share, at 28.4%, compared with 35.9% in Capital City. Public transport displayed a different pattern. Its largest proportion was recorded in Greenwich at 48.9%, followed by Capital City at 45.6% and Metropolis at 41.8%. Portville and Techton had smaller shares of 35.4% and 32.1%.
Cycling was most popular in Greenwich, at 12.3%, but represented only 3.5% of journeys in Metropolis. The corresponding figures in Portville, Techton and Capital City were 8.9%, 5.2% and 4.8%. Walking reached a high of 14.3% in Portville, whereas Techton recorded the lowest level, at 7.8%. Metropolis, Greenwich and Capital City stood at 9.1%, 8.5% and 11.7%. Use of other modes remained very limited, ranging from 1.9% in Greenwich to 3.3% in Techton.
Part 1 · Band 7 Sample Answer
The table provides information about how people travelled to work in five major cities in 2023. The figures are given as percentages for five different types of transport.
Overall, cars and public transport were the two main commuting methods in every city. Cars were the most widely used option in Metropolis, Portville and Techton, while public transport was more popular in Greenwich and Capital City. Other transport had the lowest percentage in each city.
Techton had the highest proportion of people commuting by car, at 51.6%. This was followed by Metropolis at 43.2% and Portville at 38.7%. The car figures for Capital City and Greenwich were lower, at 35.9% and 28.4%. In contrast, Greenwich had the largest public transport share, at 48.9%. Capital City ranked second at 45.6%, followed by Metropolis with 41.8%. Public transport was used by 35.4% of commuters in Portville and 32.1% in Techton.
The smaller categories showed different patterns. Cycling was highest in Greenwich at 12.3%, while Metropolis had the lowest figure of 3.5%. Portville also had a fairly high cycling share, at 8.9%. Walking was most common in Portville, where it represented 14.3% of commuters, followed by Capital City at 11.7%. The other three cities recorded walking figures below 10%. Finally, other forms of transport accounted for very small shares, from 1.9% in Greenwich to 3.3% in Techton.