Task 1 · Dynamic Pie Chart
You should spend about 20 minutes on this task. Write at least 150 words.
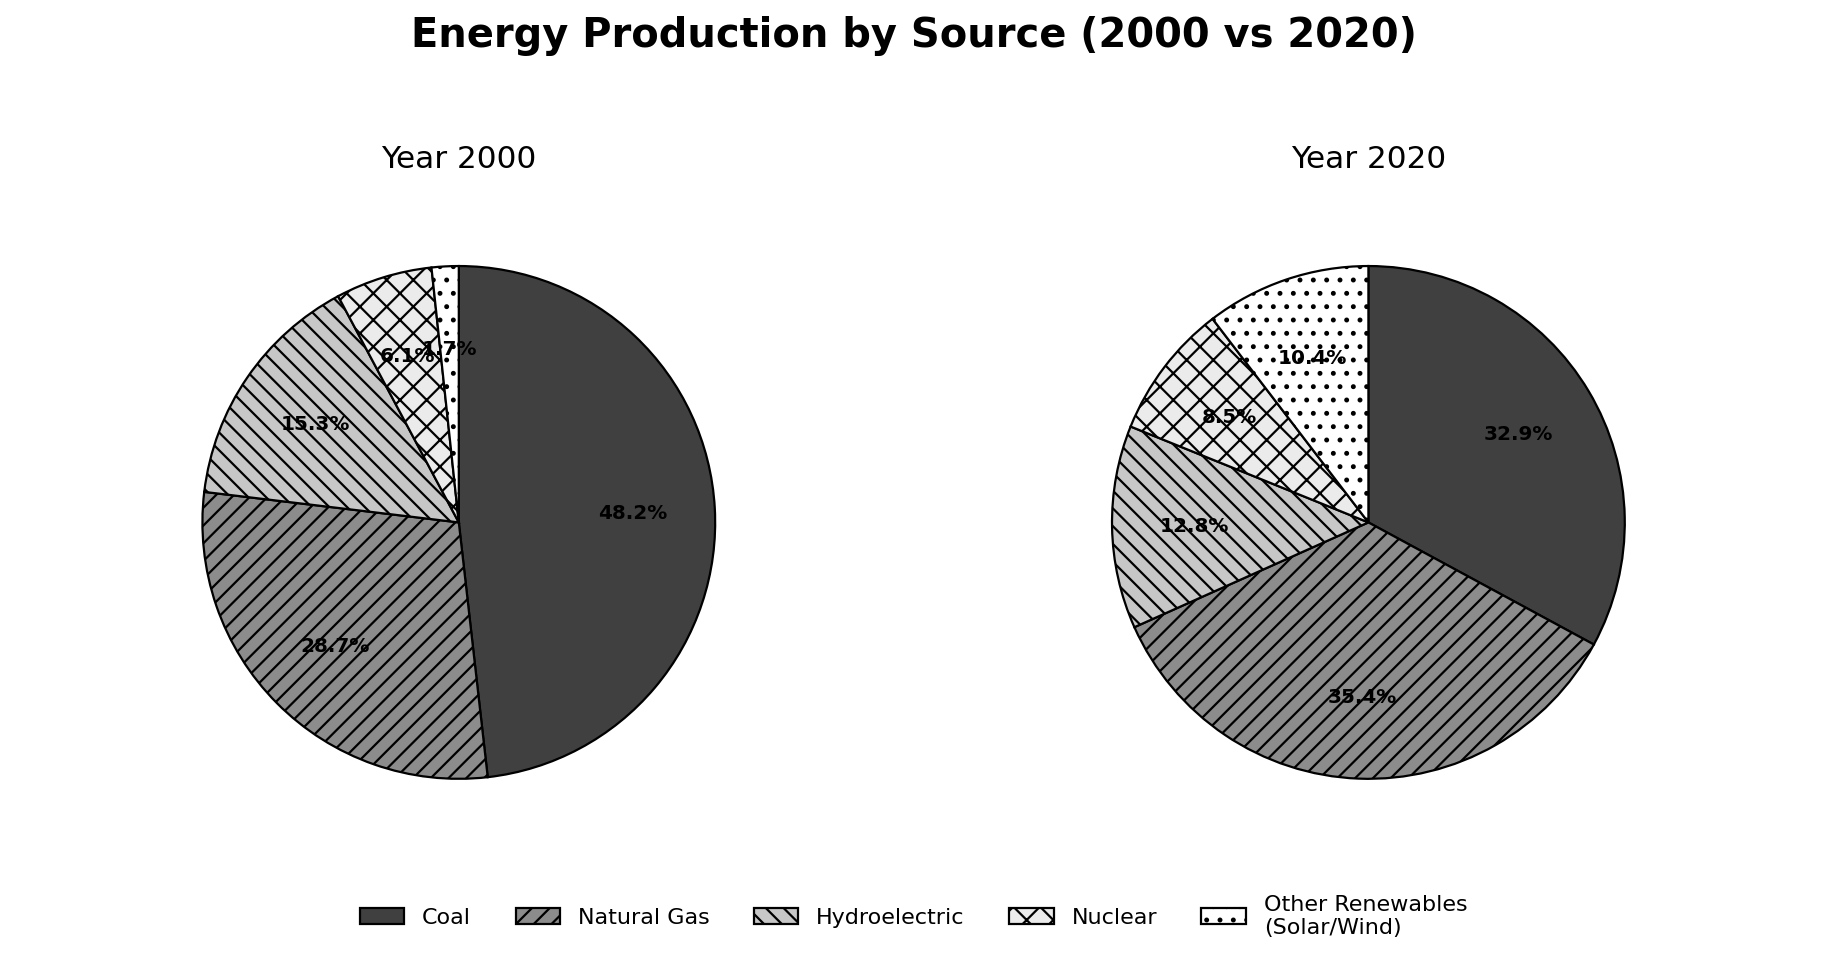
The two pie charts below show the distribution of energy production from different sources in a country for the years 2000 and 2020.
Summarise the information by selecting and reporting the main features, and make comparisons where relevant.
Want to see your estimated band score?
Check your writing scorePart 1 · Band 9 Sample Answer
The two pie charts compare the proportions of energy generated from five sources in a country in 2000 and 2020.
Overall, fossil fuels remained the dominant basis of energy production in both years, although their combined contribution declined. The mix also became markedly less reliant on coal, which was overtaken by natural gas, while nuclear power and other renewables both gained ground.
In 2000, coal alone accounted for 48.2% of national energy output, making it by far the largest source. Natural gas supplied a further 26.7%, so these two fossil fuels together represented almost three quarters of production. Hydroelectricity was the leading non-fossil source at 15.3%. By contrast, nuclear energy contributed only 6.1%, and solar and wind, grouped as other renewables, had the smallest share, at 3.7%.
Twenty years later, natural gas had risen by 8.7 percentage points to 35.4%, becoming the biggest contributor. Coal experienced a much larger movement in the opposite direction, falling by 15.3 points to 32.9%. Consequently, the combined fossil-fuel share decreased from 74.9% to 68.3%. Among the remaining sources, hydroelectric power slipped moderately to 12.8%. However, other renewables nearly tripled their proportion to 10.4%, the sharpest relative growth of any category, while nuclear production also increased, reaching 8.5%. Taken together, the three non-fossil sources therefore expanded from 25.1% to 31.7% of the total.
Part 1 · Band 8 Sample Answer
The charts illustrate the percentage of energy produced from coal, natural gas, hydroelectric power, nuclear power and other renewable sources in one country in 2000 and 2020.
Overall, coal and natural gas provided most of the country’s energy in both years. Nevertheless, coal became considerably less important over the period, whereas gas became the largest source. The shares of nuclear power and other renewables increased, while hydroelectricity declined slightly.
At the beginning of the period, nearly half of all energy came from coal, at 48.2%. This was substantially more than the figure for natural gas, which stood at 26.7%. Hydroelectric power ranked third and produced 15.3% of the total. The two smallest categories were nuclear energy and other renewables, contributing 6.1% and 3.7% respectively.
By 2020, the proportion supplied by coal had fallen sharply to 32.9%, a reduction of 15.3 percentage points. In contrast, natural gas increased to 35.4%, placing it slightly ahead of coal. Changes among the other sources were less dramatic in absolute terms. Hydroelectricity decreased by 2.5 points to 12.8%, but other renewables rose strongly to 10.4%, almost three times their original share. Nuclear power also grew, although more modestly, to 8.5%. As a result, sources other than coal and gas collectively accounted for 31.7% of production in 2020, compared with 25.1% in 2000.
Part 1 · Band 7 Sample Answer
The two charts show how energy production in a country was divided among five different sources in 2000 and 2020.
Overall, coal and natural gas were the main energy sources in both years. However, coal lost a large part of its share and was replaced by natural gas as the biggest source in 2020. Other renewables and nuclear power became more important, while the proportion for hydroelectric power fell.
In 2000, coal made up 48.2% of energy production, which was almost twice the share of natural gas at 26.7%. Hydroelectricity was the third-largest source, accounting for 15.3%. Much smaller proportions came from nuclear power and other renewables such as solar and wind, at 6.1% and 3.7% respectively. Altogether, coal and gas supplied 74.9% of the energy produced that year.
By 2020, natural gas had increased to 35.4% and moved into first place. At the same time, the figure for coal dropped significantly to 32.9%. Hydroelectricity also declined, but only from 15.3% to 12.8%. In comparison, the share of other renewables rose considerably to 10.4%, while nuclear energy grew to 8.5%. Therefore, although fossil fuels still provided over two thirds of production in 2020, the country used a more balanced range of energy sources than it had twenty years earlier.