Task 1 · Dynamic Grouped Bar Chart
You should spend about 20 minutes on this task. Write at least 150 words.
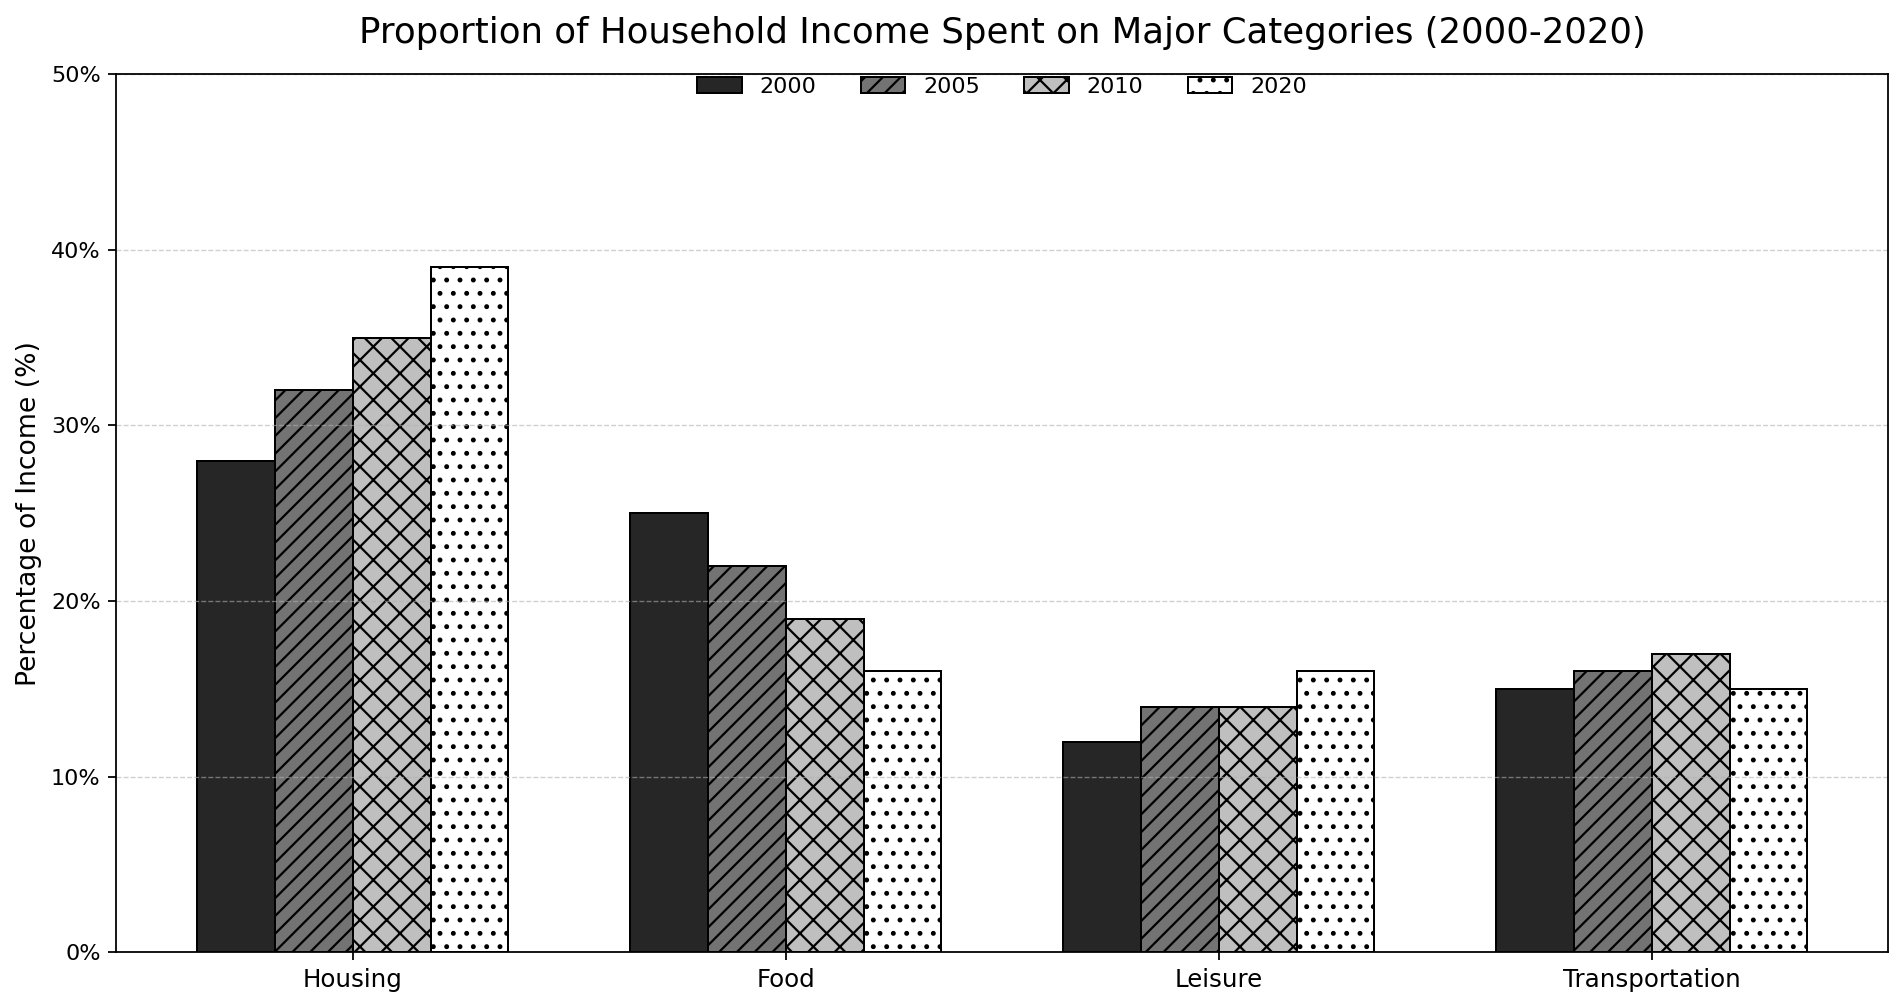
The chart below shows the proportion of household income spent on four major categories in a European country between 2000 and 2020.
Summarise the information by selecting and reporting the main features, and make comparisons where relevant.
Want to see your estimated band score?
Check your writing scorePart 1 · Band 9 Sample Answer
The bar chart compares the percentages of household income allocated to housing, food, leisure and transportation in a European nation in 2000, 2005, 2010 and 2020.
Overall, housing absorbed the largest share of income in every year shown, and this proportion rose considerably over the period. By contrast, spending on food declined steadily. The figures for leisure and transportation were substantially lower and changed only modestly, with food and leisure accounting for equal shares by 2020.
In 2000, households devoted 28% of their income to housing, only three percentage points more than the 25% spent on food. The gap subsequently widened in each surveyed year: housing expenditure increased to 32% in 2005 and 35% in 2010, before reaching a peak of 39% in 2020. Food followed precisely the opposite pattern, falling by three points at each interval, from 25% initially to 22%, 19% and finally 16%. Consequently, the difference between these two categories expanded from just 3 to 23 percentage points.
The remaining categories displayed much less variation. Leisure represented the smallest expense in 2000, at 12%, but rose to 14% in 2005 and remained at that level in 2010. A further increase to 16% in 2020 placed it level with food. Transportation, meanwhile, edged up from 15% to 16% and then 17% across the first three years shown. It subsequently returned to 15%, making it the smallest of the four categories at the end of the period.
Part 1 · Band 8 Sample Answer
The chart illustrates the proportion of household earnings spent on four main categories in a European country in selected years from 2000 to 2020.
Overall, housing consistently accounted for the greatest percentage and became increasingly dominant over time. Food expenditure moved in the opposite direction, declining throughout the period. Spending on leisure rose slightly, whereas the share allocated to transportation fluctuated within a narrow range.
In 2000, 28% of household income was used for housing and 25% for food, so the difference between the two largest categories was only three percentage points. Housing then increased to 32% in 2005 and 35% in 2010. By 2020, it had reached 39%, representing an overall rise of 11 points. In comparison, the proportion spent on food dropped to 22% in 2005 and 19% five years later, before falling further to 16% in the final year.
Leisure and transportation both took much smaller shares of household budgets. Leisure spending stood at 12% in 2000, the lowest figure on the chart, and increased to 14% in 2005. It remained unchanged in 2010 before reaching 16% in 2020, the same level as food. Transportation began at 15% and rose gradually to 16% in 2005 and 17% in 2010. However, this trend was reversed by 2020, when its share returned to 15% and became slightly lower than both food and leisure.
Part 1 · Band 7 Sample Answer
The bar chart shows how much of household income was spent on housing, food, leisure and transportation in a European country in 2000, 2005, 2010 and 2020.
Overall, housing was the largest expense in all four years, and its share increased steadily. In contrast, the percentage for food fell over time. Leisure spending rose moderately, while transportation changed very little across the period.
Households spent 28% of their income on housing in 2000. This figure climbed to 32% in 2005 and 35% in 2010, before reaching 39% in 2020. Food showed a clear downward trend. It accounted for 25% of income at the start, making it the second-largest category. The proportion then declined to 22% in 2005, 19% in 2010 and 16% in the final year. Therefore, the gap between housing and food became much wider, rising from three percentage points in 2000 to 23 points in 2020.
The other two categories remained below 20% throughout. Leisure was the smallest expense in 2000, at 12%. It rose to 14% in both 2005 and 2010 and then to 16% in 2020, equal to the figure for food. Transportation accounted for 15% in 2000 and increased slightly to 16% in 2005 and 17% in 2010. It later fell back to 15%, which was the lowest proportion among the four categories in 2020.