Task 1 · Static Table
You should spend about 20 minutes on this task. Write at least 150 words.
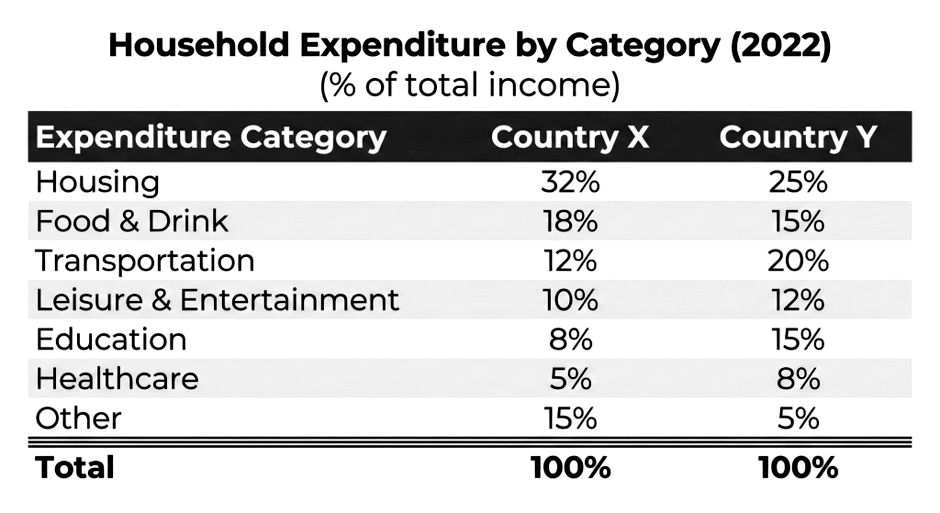
The table below gives information about the proportion of household income spent on different categories of goods and services in two countries in the year 2022.
Summarise the information by selecting and reporting the main features, and make comparisons where relevant.
Want to see your estimated band score?
Check your writing scorePart 1 · Band 9 Sample Answer
The table compares the percentages of total household income allocated to seven categories of expenditure in Country X and Country Y in 2022.
Overall, housing represented the largest expense in both countries. Households in Country X devoted greater proportions of their income to housing, food and drink, and other items, whereas those in Country Y spent relatively more on each of the remaining four categories. The most pronounced contrasts concerned other expenditure and transportation.
In Country X, almost one third of income was used for housing, at 32%, which was seven percentage points above the figure for Country Y. Food and drink ranked second in Country X, accounting for 18%, compared with 15% in Country Y. The difference was widest for the other category in relative terms: its 15% share in Country X was three times Country Y’s 5%. Together, these three areas absorbed 65% of income in Country X but only 45% in Country Y.
By contrast, transportation took 20% of household income in Country Y, making it the country’s second-largest expense, while the corresponding proportion in Country X was 12%. Country Y also allocated 15% to education, nearly twice Country X’s 8%. Its shares for leisure and entertainment and healthcare were likewise higher, though by smaller margins, at 12% versus 10% and 8% versus 5%, respectively.
Part 1 · Band 8 Sample Answer
The table shows how households in two countries distributed their income among seven types of goods and services in 2022, with all figures expressed as percentages.
Overall, housing accounted for the greatest proportion of income in both Country X and Country Y. However, Country X spent more on basic housing and food as well as the miscellaneous other category, while Country Y assigned larger shares to transportation, leisure, education and healthcare.
Housing made up 32% of household income in Country X, compared with 25% in Country Y. Food and drink was also higher in X, at 18%, three percentage points more than the 15% recorded in Y. A particularly clear difference can be seen in other spending: this represented 15% in Country X but only 5% in Country Y, the smallest figure in that country. These three categories together accounted for almost two thirds of income in X.
Country Y, on the other hand, spent a fifth of its household income on transportation, whereas the proportion in Country X was just 12%. Education also received a noticeably larger allocation in Y, at 15%, compared with 8% in X. The gaps in the final two categories were less substantial. Leisure and entertainment represented 12% in Country Y and 10% in Country X, while the respective figures for healthcare were 8% and 5%. Healthcare was therefore the smallest expense in Country X.
Part 1 · Band 7 Sample Answer
The table compares the percentage of household income spent on seven categories in Country X and Country Y in 2022.
Overall, housing was the biggest expense in both countries, although its share was higher in Country X. Country X also spent more on food and drink and other items, while Country Y used a larger proportion of income for transportation, leisure and entertainment, education, and healthcare.
In Country X, households spent 32% of their income on housing, compared with 25% in Country Y. Food and drink took 18% in X and 15% in Y. There was also a large difference in the other category. This accounted for 15% of income in Country X, which was three times the figure of 5% in Country Y.
The opposite pattern can be seen in the remaining categories. Transportation represented 20% of income in Country Y, making it the second-largest category there, but it accounted for only 12% in Country X. Similarly, the percentage for education was 15% in Y, compared with 8% in X. The differences were smaller for leisure and healthcare. Country Y spent 12% on leisure and entertainment and 8% on healthcare, whereas the figures for Country X were 10% and 5% respectively. Healthcare was the lowest category in X, while other spending was the smallest in Y.