Task 1 · Dynamic Mixed Chart
You should spend about 20 minutes on this task. Write at least 150 words.
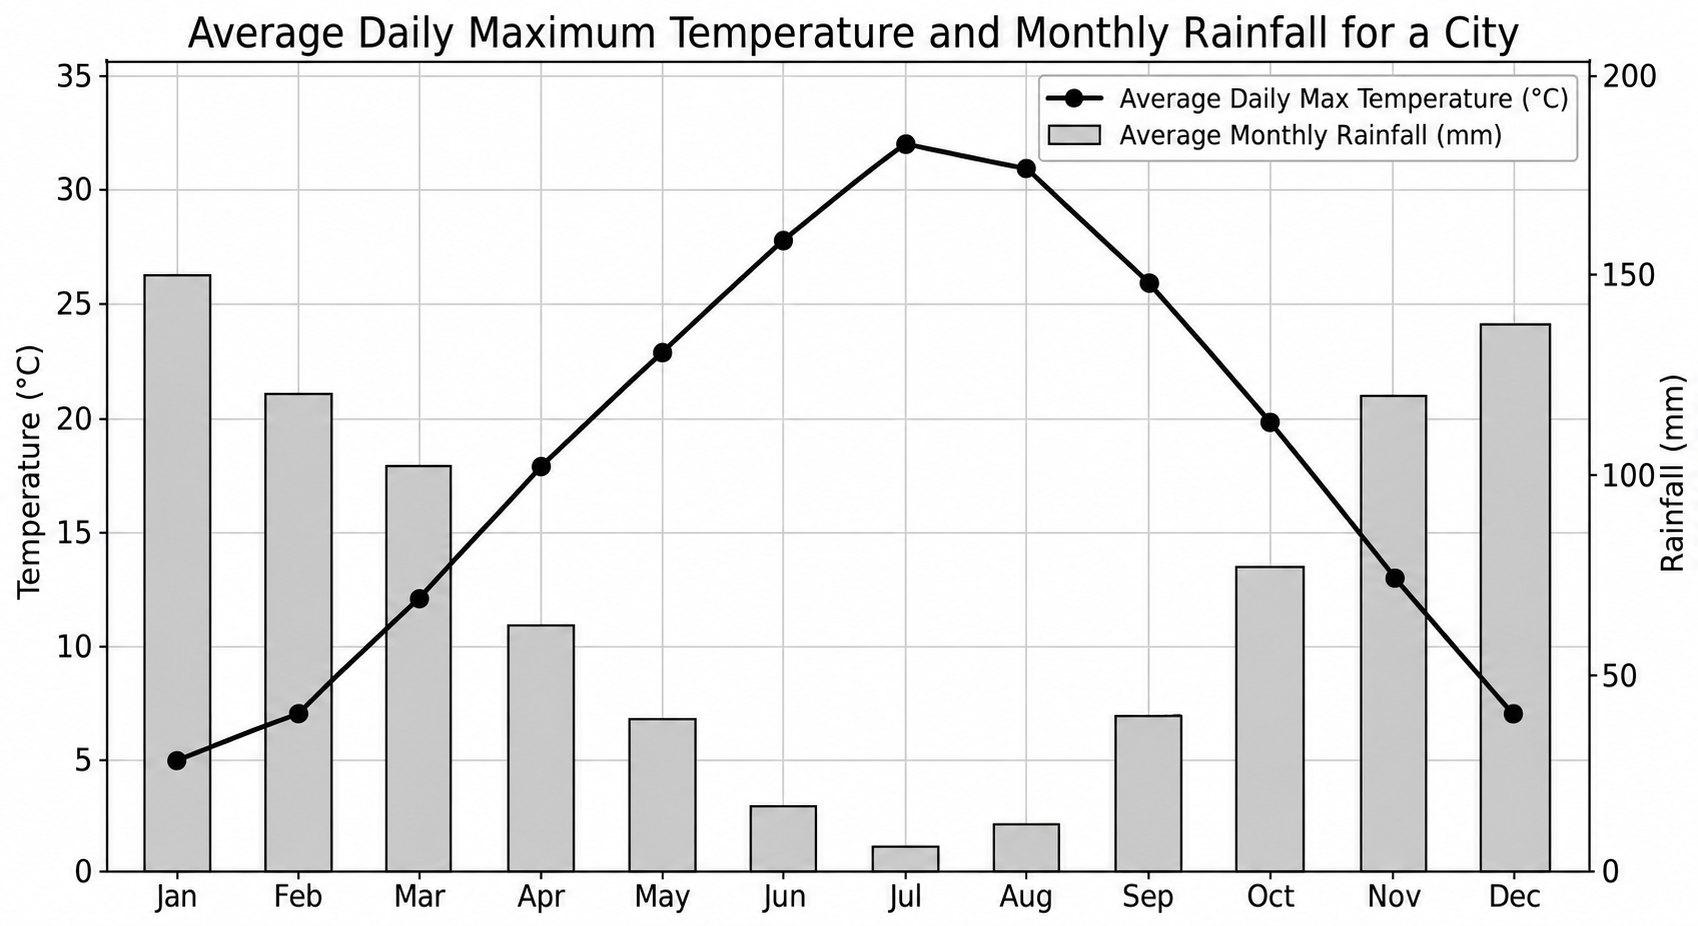
The graph below shows the changes in the average daily maximum temperature (in degrees Celsius) and the average monthly rainfall (in millimetres) for a city over the course of a year.
Summarise the information by selecting and reporting the main features, and make comparisons where relevant.
Want to see your estimated band score?
Check your writing scorePart 1 · Band 9 Sample Answer
The graph compares a city’s average daily maximum temperature with its average monthly rainfall throughout the year, measured in degrees Celsius and millimetres respectively.
Overall, the two measures follow almost opposite seasonal patterns. Temperatures rise steadily from the beginning of the year to a mid-year peak in July before declining, whereas rainfall falls sharply over the same period and then recovers. Consequently, July is both the hottest and driest month, while January records the lowest maximum temperature and the greatest rainfall.
The average daily high begins at 5°C in January and increases to 7°C in February and 12°C in March. The rise then accelerates, with the figure reaching 18°C in April, 23°C in May and approximately 28°C in June. It peaks at 32°C in July, remains almost as high at 31°C in August, and subsequently drops to 26°C in September. Further declines take the average to 20°C in October, 13°C in November and 7°C by December.
Rainfall moves in the reverse direction. From a yearly high of 150 mm in January, it decreases to about 120 mm in February and 100 mm in March. Monthly precipitation then falls from roughly 60 mm in April to 40 mm in May and 20 mm in June, reaching a low of only around 5 mm in July. After a slight increase to 10 mm in August, rainfall climbs to 40 mm in September and approximately 75 mm in October. It then rises substantially to 120 mm in November and finishes at 140 mm in December.
Part 1 · Band 8 Sample Answer
The chart presents information about average daily maximum temperatures and average monthly rainfall in a particular city across the twelve months of the year.
Overall, temperature and rainfall display contrasting trends. The temperature rises continuously until July and then falls for the remainder of the year. By comparison, rainfall declines to its minimum in July before increasing again. January is the wettest and coolest month, while July has the highest temperature and least rain.
In January, the average maximum temperature is 5°C. It rises modestly to 7°C in February and then reaches 12°C in March. A stronger increase follows, taking the figure to 18°C in April, 23°C in May and about 28°C in June. The temperature reaches a high of 32°C in July and remains close to this level in August, at 31°C. It then falls to 26°C in September and 20°C in October, before ending the year at 13°C in November and 7°C in December.
Rainfall begins at 150 mm in January, the highest amount shown, and drops to around 120 mm in February and 100 mm in March. It continues to decrease through the following months, reaching approximately 60 mm in April and 40 mm in May. After falling to 20 mm in June, it reaches its lowest point of roughly 5 mm in July. The total rises only slightly to 10 mm in August, but then increases more rapidly to 40 mm in September and about 75 mm in October. November receives around 120 mm, followed by 140 mm in December.
Part 1 · Band 7 Sample Answer
The graph shows how the average daily highest temperature and the average amount of monthly rainfall change during a year in one city.
Overall, the temperature becomes higher from January to July and then decreases towards December. Rainfall follows the opposite pattern, falling during the first seven months and rising afterwards. July is the hottest and driest month, whereas January has the lowest temperature and the most rain.
At the start of the year, the average maximum temperature is 5°C. This increases to 7°C in February and 12°C in March. It then rises more quickly, reaching 18°C in April, 23°C in May and around 28°C in June. The highest figure is 32°C in July. After remaining high at 31°C in August, the temperature drops to 26°C in September and 20°C in October. It falls further to 13°C in November and 7°C in December.
The city receives 150 mm of rain in January. Rainfall then declines to about 120 mm in February and 100 mm in March, before falling to roughly 60 mm in April. The totals for May and June are lower, at around 40 mm and 20 mm respectively. Rainfall reaches a minimum of about 5 mm in July and rises slightly to 10 mm in August. It then increases to 40 mm in September, approximately 75 mm in October and 120 mm in November. By December, the monthly total has reached 140 mm.