Task 1 · Static Table
You should spend about 20 minutes on this task. Write at least 150 words.
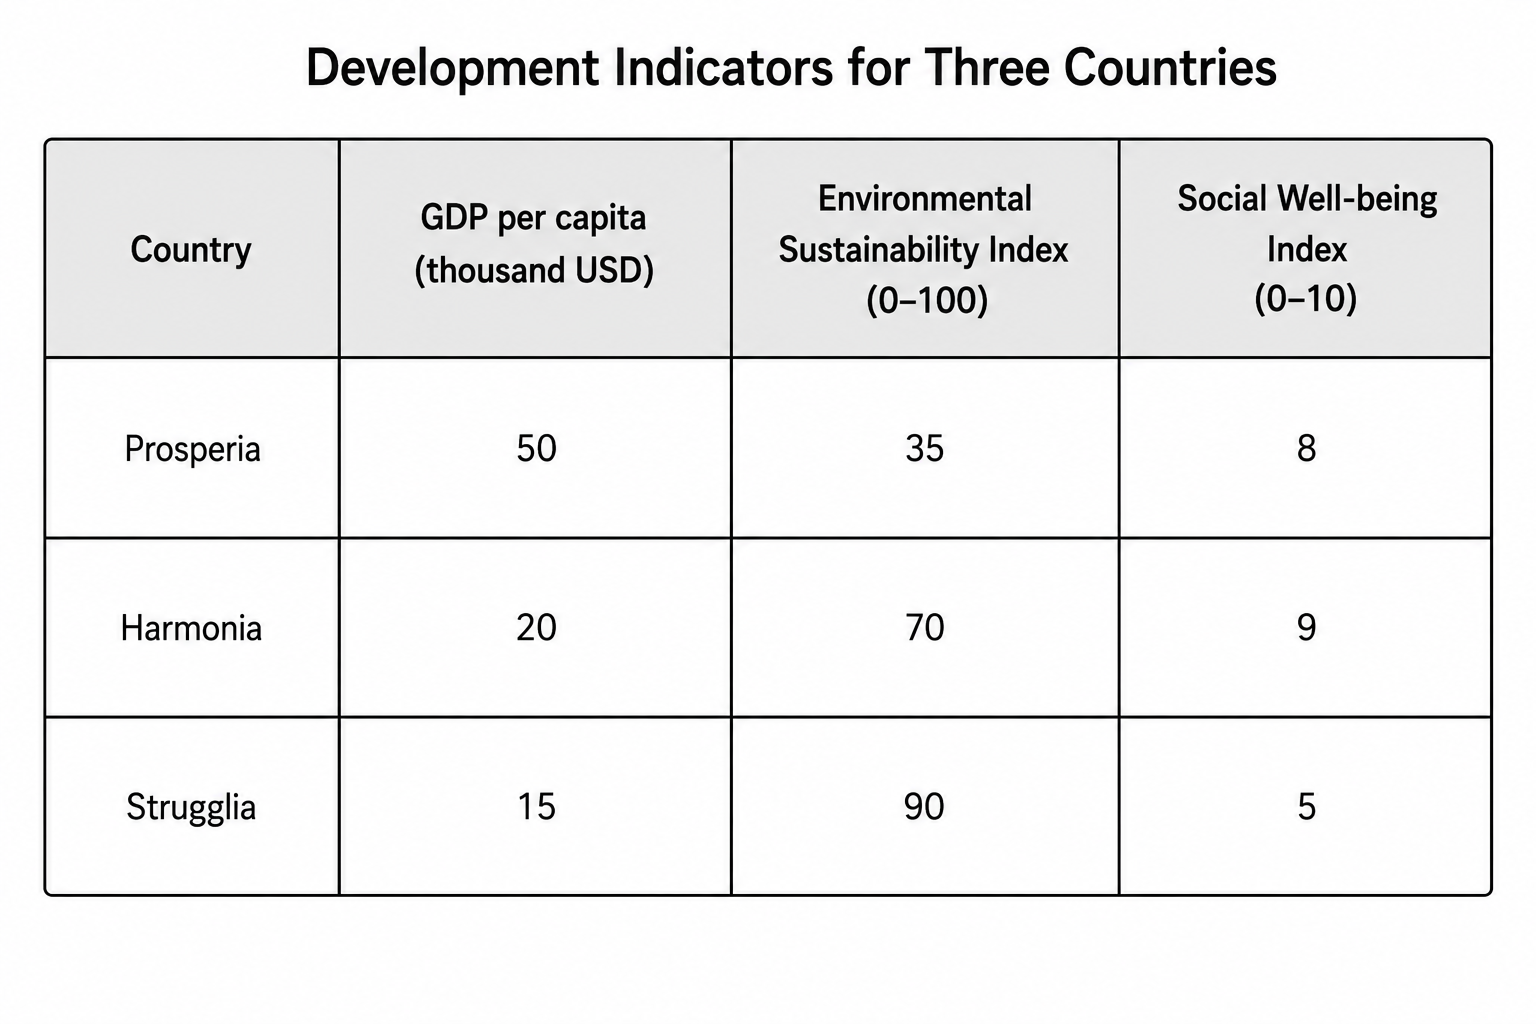
The table below compares three countries in terms of GDP per capita, environmental sustainability and social well-being.
Summarise the information by selecting and reporting the main features, and make comparisons where relevant.
Want to see your estimated band score?
Check your writing scorePart 1 · Band 9 Sample Answer
The table compares Prosperia, Harmonia and Strugglia using three measures of development: GDP per person, environmental sustainability and social well-being.
Overall, none of the three countries ranks first across all indicators. Prosperia is by far the wealthiest but has the weakest environmental performance, while Strugglia displays the reverse pattern. Harmonia occupies an intermediate economic and environmental position and records the highest level of social well-being.
Prosperia has a GDP per capita of $50,000, which is two and a half times Harmonia’s figure of $20,000 and more than three times the $15,000 recorded in Strugglia. Despite this considerable economic advantage, its environmental sustainability score is only 35 out of 100, the lowest in the table. Nevertheless, Prosperia performs relatively well socially, with an index value of 8 out of 10.
Harmonia achieves the strongest social well-being result, at 9, despite having a GDP per head that is $30,000 below Prosperia’s. Its environmental index stands at 70, exactly double the score for Prosperia but 20 points below that of Strugglia. Although Strugglia leads environmental sustainability with an impressive score of 90, it has both the lowest GDP per capita, at $15,000, and the poorest social well-being result, at 5. Thus, greater environmental performance is not consistently associated with either higher income or stronger social outcomes in these countries.
Part 1 · Band 8 Sample Answer
The table provides information about GDP per capita, environmental sustainability and social well-being in three countries: Prosperia, Harmonia and Strugglia.
Overall, each country performs strongly in a different area. Prosperia has the highest income but the lowest environmental score, whereas Strugglia is the most environmentally sustainable despite being the poorest. Harmonia has the highest social well-being index and ranks between the other two countries on the remaining measures.
At $50,000, GDP per person in Prosperia is considerably higher than the figures for Harmonia and Strugglia, which stand at $20,000 and $15,000 respectively. However, Prosperia receives an environmental sustainability score of just 35 out of 100. This is half Harmonia’s result of 70 and substantially below Strugglia’s leading figure of 90.
The pattern is different for social well-being. Harmonia ranks first with 9 points out of 10, one point higher than Prosperia. This is notable because Harmonia’s GDP per capita is less than half that of Prosperia. Strugglia, meanwhile, has the lowest social score, at 5, even though it performs best environmentally. Its income per head is also the smallest, only $5,000 below Harmonia’s but $35,000 lower than Prosperia’s. The figures therefore show that the country with the greatest wealth does not lead in either environmental sustainability or social well-being.
Part 1 · Band 7 Sample Answer
The table compares three countries called Prosperia, Harmonia and Strugglia in terms of income per person, environmental sustainability and social well-being.
Overall, Prosperia is the richest country, while Strugglia has the best environmental result. Harmonia receives the highest score for social well-being. This means that no country has the highest figure in all three categories.
Prosperia has a GDP per capita of $50,000, which is much higher than the other two countries. Harmonia’s figure is $20,000, while Strugglia has the lowest income per person at $15,000. However, the order is completely different for environmental sustainability. Strugglia has the highest score at 90 out of 100, followed by Harmonia at 70. Prosperia is in last place in this category, with an index of only 35.
For social well-being, Harmonia records the best result of 9 out of 10. Prosperia is close behind with a score of 8, even though its environmental result is much lower. Strugglia has a social well-being index of 5, the lowest of the three countries. Therefore, although Strugglia performs very well in protecting the environment, this is not matched by its economic or social figures. Similarly, Prosperia’s high level of wealth does not result in the strongest environmental or social scores.