Task 1 · Dynamic Multiple-Line Graph
You should spend about 20 minutes on this task. Write at least 150 words.
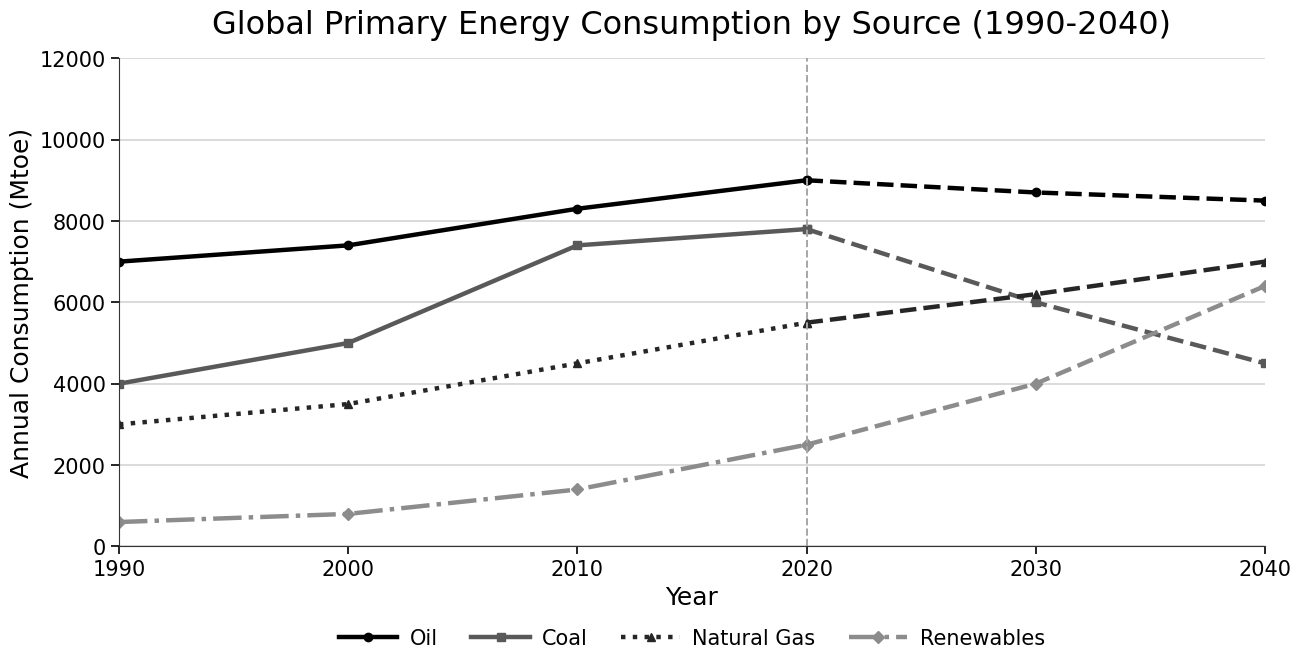
The graph below shows global primary energy consumption from four sources between 1990 and 2040, with figures after 2020 given as projections.
Summarise the information by selecting and reporting the main features, and make comparisons where relevant.
Want to see your estimated band score?
Check your writing scorePart 1 · Band 9 Sample Answer
The line graph compares worldwide primary energy consumption from oil, coal, natural gas and renewable sources between 1990 and 2040, measured in million tonnes of oil equivalent, with the final two data points representing forecasts.
Overall, oil remains the dominant energy source throughout, despite a moderate decline after reaching a peak in 2020. Coal consumption is also expected to fall substantially, whereas natural gas and renewables continue to rise. By 2040, coal is projected to become the least-used source, while renewables experience the largest proportional increase.
Oil consumption grew from 7,000 Mtoe in 1990 to approximately 7,400 in 2000, before climbing to 8,300 in 2010 and peaking at 9,000 in 2020. Coal followed a steeper upward trajectory, rising from 4,000 to 7,800 Mtoe over the same period. Natural gas increased more steadily, from 3,000 to 5,500, while renewable consumption, initially negligible at roughly 600 Mtoe, reached 2,500 by 2020.
Thereafter, oil use is forecast to edge down to 8,700 Mtoe in 2030 and 8,500 in 2040. Coal is expected to decline far more sharply, falling to 6,000 and then 4,500. In contrast, natural gas consumption is projected to rise to about 6,200 in 2030, overtaking coal, and to 7,000 by 2040. Renewables will grow even faster, reaching 4,000 and 6,500 Mtoe respectively, thereby surpassing coal by the end of the period.
Part 1 · Band 8 Sample Answer
The line graph illustrates changes in global consumption of oil, coal, natural gas and renewable energy from 1990 to 2040. The figures are measured in Mtoe, and those for 2030 and 2040 are projections.
Overall, oil is the most heavily consumed source in every year shown. However, both oil and coal are predicted to decline after 2020, particularly coal. By comparison, natural gas and renewables are expected to continue growing, with coal becoming the least-used source by 2040.
In 1990, oil consumption stood at 7,000 Mtoe, considerably higher than coal at 4,000 and natural gas at 3,000. Oil then rose gradually to 7,400 in 2000 and 8,300 in 2010, before reaching 9,000 Mtoe in 2020. Coal increased more rapidly, climbing to 5,000 in 2000 and 7,400 in 2010, followed by a peak of 7,800 in 2020. Natural gas also grew steadily to 5,500 Mtoe, while renewables rose from around 600 to 2,500.
After 2020, oil consumption is forecast to fall slightly, reaching 8,500 Mtoe in 2040. Coal is projected to drop much more significantly, first to 6,000 in 2030 and then to 4,500. In contrast, natural gas will increase to roughly 6,200 and 7,000 Mtoe in these two years. Renewable energy is expected to show the fastest growth, rising to 4,000 in 2030 and 6,500 by 2040, when it will exceed coal consumption by 2,000 Mtoe.
Part 1 · Band 7 Sample Answer
The graph shows how much oil, coal, natural gas and renewable energy was consumed worldwide between 1990 and 2020, together with predictions for 2030 and 2040. The figures are given in Mtoe.
Overall, oil is the largest source of energy throughout the period. Oil and coal consumption are expected to decrease after 2020, while natural gas and renewables will continue to increase. Coal is predicted to have the lowest figure by 2040.
In 1990, the amount of oil consumed was 7,000 Mtoe. This rose to around 7,400 in 2000 and 8,300 in 2010, before reaching 9,000 in 2020. Coal also increased considerably, from 4,000 Mtoe in 1990 to 5,000 in 2000 and 7,400 in 2010. It reached its highest point of 7,800 in 2020. Natural gas grew more gradually from 3,000 to 5,500 Mtoe during these three decades. Renewables remained the smallest source, although their figure increased from about 600 to 2,500.
Oil use is forecast to fall slightly to 8,700 Mtoe in 2030 and 8,500 in 2040. Coal will decline more sharply to 6,000 and then 4,500. Meanwhile, natural gas is expected to rise to approximately 6,200 in 2030 and 7,000 in 2040. Renewable consumption will also grow quickly, reaching 4,000 and 6,500 Mtoe respectively. As a result, both natural gas and renewables will be used more than coal by the final year.