Task 1 · Static Grouped Bar Chart
You should spend about 20 minutes on this task. Write at least 150 words.
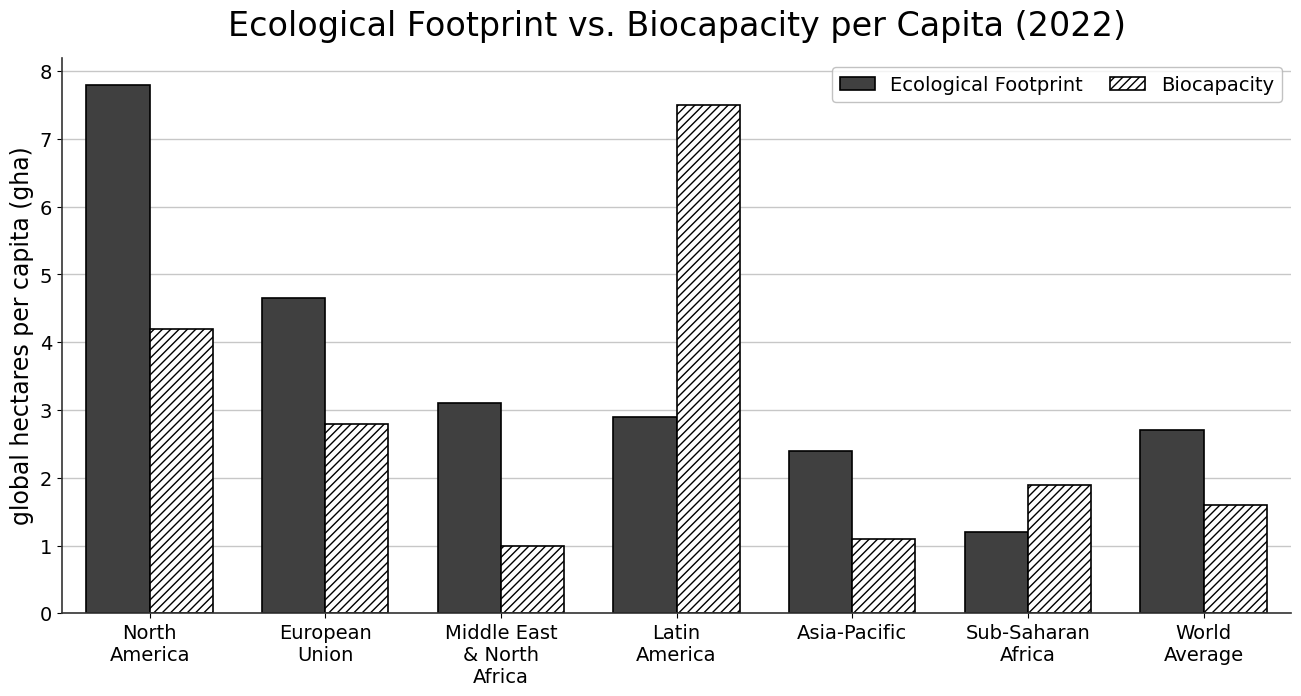
The chart below compares the ecological footprint and biocapacity per capita of six major regions and the world average in 2022.
Summarise the information by selecting and reporting the main features, and make comparisons where relevant.
Want to see your estimated band score?
Check your writing scorePart 1 · Band 9 Sample Answer
The bar chart compares the ecological footprint and biocapacity per person in six regions and worldwide in 2022. Both indicators are measured in global hectares per capita.
Overall, ecological demand exceeded biocapacity in four of the six regions and across the world as a whole. Latin America and Sub-Saharan Africa were the only regions with an ecological reserve. North America had by far the largest footprint, whereas Latin America possessed the greatest biocapacity. Sub-Saharan Africa recorded the smallest footprint, and the Middle East and North Africa had the lowest biocapacity.
North America’s footprint stood at approximately 7.8 global hectares per person, compared with a capacity of 4.2, producing the largest deficit shown. The European Union also consumed substantially more than its ecosystems could support, with respective figures of about 4.7 and 2.8. A similar imbalance appeared in the Middle East and North Africa, where a footprint of 3.1 was more than three times its biocapacity of 1.0. In Asia-Pacific, the corresponding values were roughly 2.4 and 1.1.
By contrast, Latin America combined a moderate footprint of around 2.9 with an exceptionally high biocapacity of 7.5, giving it the largest surplus by a considerable margin. Sub-Saharan Africa also remained within its ecological capacity, although at much lower levels, with a footprint of 1.2 against biocapacity of 1.9. Globally, the average footprint was approximately 2.7 global hectares per capita, exceeding the capacity of 1.6 by about 1.1.
Part 1 · Band 8 Sample Answer
The chart illustrates the ecological footprint and biocapacity per capita in six regions and worldwide in 2022. The figures are expressed in global hectares per person.
Overall, the footprint was greater than biocapacity in North America, the European Union, the Middle East and North Africa, and Asia-Pacific, as well as at the global level. Only Latin America and Sub-Saharan Africa had more biocapacity than their ecological demand. North America recorded the highest footprint, while Latin America had the greatest capacity.
North America’s ecological footprint was about 7.8 global hectares per capita, almost twice its biocapacity of 4.2. The European Union showed the same pattern, although its figures were lower, at approximately 4.7 and 2.8 respectively. In the Middle East and North Africa, the footprint reached 3.1, compared with only 1.0 for biocapacity. Asia-Pacific also had a deficit, with ecological demand of around 2.4 global hectares per person and a capacity of just 1.1.
Latin America differed sharply from these regions. Its biocapacity was approximately 7.5 global hectares per capita, the highest figure on the chart, whereas its footprint was only 2.9. Sub-Saharan Africa had much smaller values but also maintained a surplus, as its capacity of 1.9 exceeded its footprint of 1.2. Finally, the world average showed a footprint of about 2.7 global hectares per person and biocapacity of 1.6, meaning that global demand was roughly 1.1 hectares above available capacity.
Part 1 · Band 7 Sample Answer
The bar chart shows the ecological footprint and biocapacity per person in six major regions and the world average in 2022. The unit used is global hectares per capita.
Overall, four regions had a larger ecological footprint than their biocapacity. Latin America and Sub-Saharan Africa were the only regions where capacity was higher than demand. North America had the greatest footprint, while Latin America had the highest biocapacity. The lowest figures were found in Sub-Saharan Africa for footprint and in the Middle East and North Africa for biocapacity.
North America’s ecological footprint was about 7.8 global hectares per person, while its biocapacity was around 4.2. The European Union also had a clear gap, with figures of approximately 4.7 and 2.8 respectively. In the Middle East and North Africa, the footprint was 3.1, over three times the capacity of 1.0. Asia-Pacific recorded about 2.4 for its footprint and 1.1 for biocapacity.
Latin America showed a very different result. Its footprint was only around 2.9 global hectares per capita, but its biocapacity reached 7.5, the highest value in the chart. Sub-Saharan Africa had the smallest footprint, at 1.2, and its capacity was somewhat higher at 1.9. The world average was approximately 2.7 for ecological footprint and 1.6 for biocapacity. Therefore, the average person’s demand was about 1.1 global hectares above the available level.