Task 1 · Static Bubble Chart
You should spend about 20 minutes on this task. Write at least 150 words.
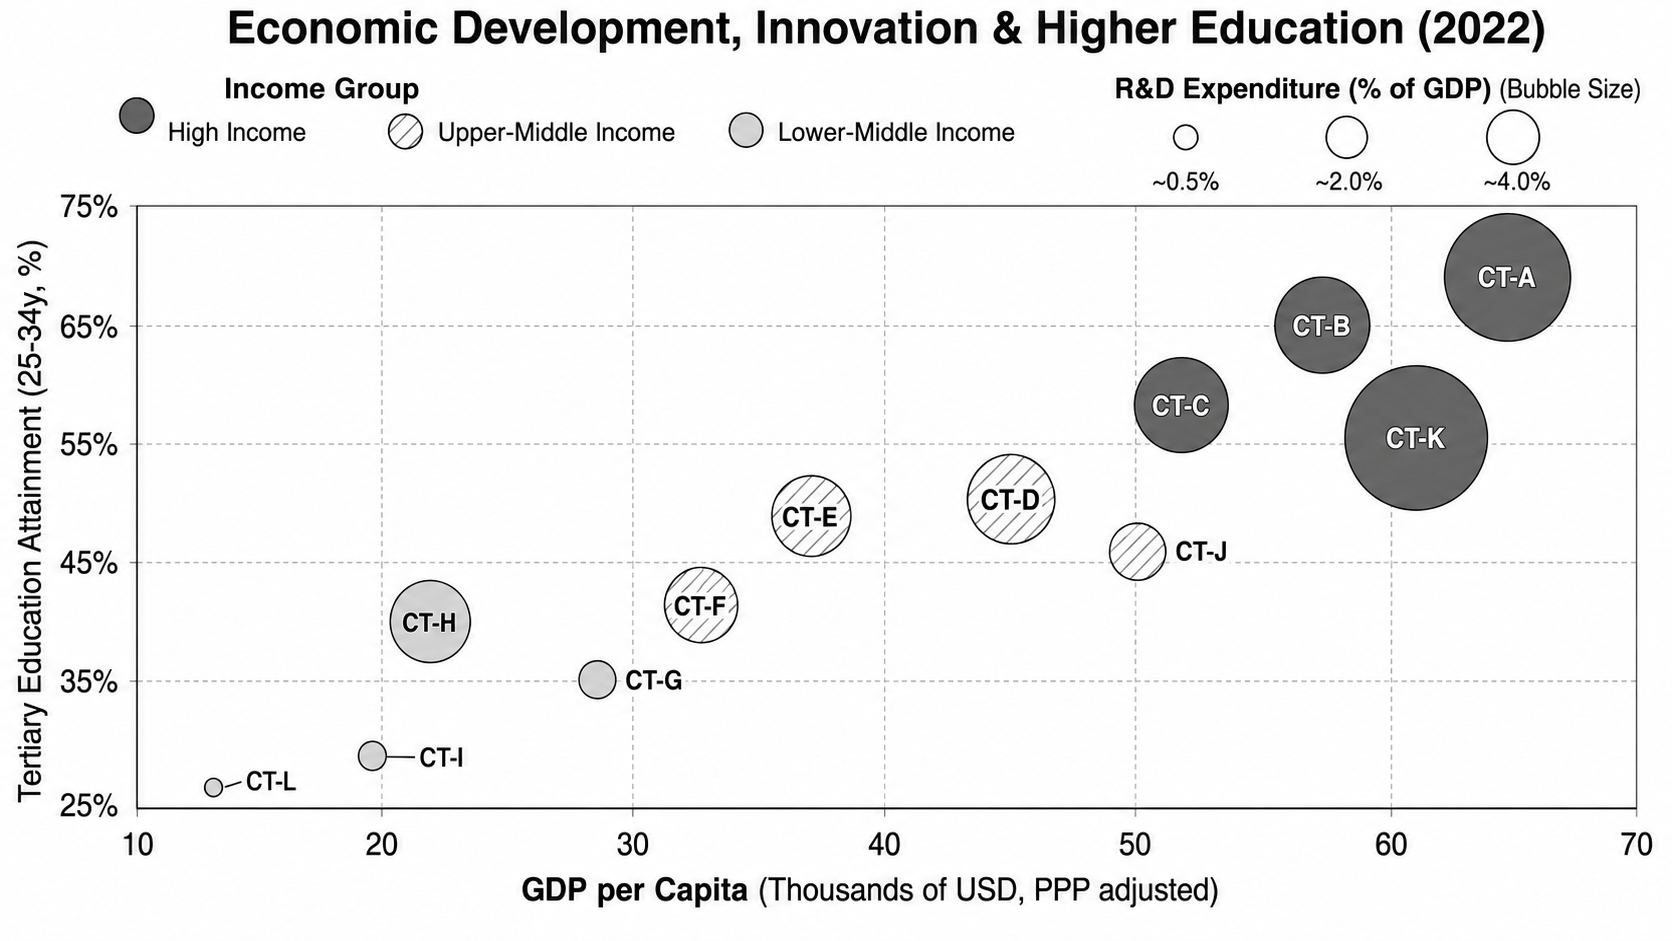
The chart below presents a multi-dimensional analysis of the relationship between national economic development, investment in innovation, and tertiary education attainment for a selection of twelve countries in 2022.
Summarise the information by selecting and reporting the main features, and make comparisons where relevant.
Want to see your estimated band score?
Check your writing scorePart 1 · Band 9 Sample Answer
The bubble chart compares twelve countries in 2022 in terms of GDP per capita and tertiary education attainment among 25–34-year-olds. It also classifies them by income group, while bubble size indicates research and development expenditure as a proportion of GDP.
Overall, higher income was generally associated with higher tertiary attainment. High-income countries occupied the upper-right section, whereas lower-middle-income nations were concentrated towards the lower left. R&D investment also tended to be greater among richer countries, although neither education nor innovation spending rose uniformly with GDP.
Among the high-income economies, CT-A recorded both the highest GDP per head, at about $65,000, and the greatest tertiary attainment, at roughly 69%. CT-B followed with figures of approximately $57,000 and 65%, while CT-C stood at around $52,000 and 58%. CT-K had a higher income than both but a lower education rate of about 56%. Its bubble was the largest on the chart, indicating the greatest R&D commitment, with CT-A ranking next.
The upper-middle-income countries formed a central cluster. Across CT-F, CT-E and CT-D, values ranged from about $33,000 and 41% to $45,000 and 50%, while CT-J, at $50,000, had a lower attainment rate of around 46%. In the lower-middle group, CT-L and CT-I posted the lowest pairs of values, at roughly $13,000 and 27%, and $20,000 and 29%. CT-G reached about $29,000 but only 35%, whereas CT-H achieved 40% despite a lower GDP of approximately $22,000. CT-H also had the largest R&D bubble within this group, while CT-L had the smallest overall.
Part 1 · Band 8 Sample Answer
The chart illustrates the relationship between GDP per capita and tertiary education attainment in twelve countries in 2022. The shading divides countries into three income groups, and bubble size represents R&D spending as a percentage of GDP.
Overall, countries with higher GDP per person usually had higher tertiary education levels among people aged 25–34. The high-income countries appeared in the top-right area, while most lower-middle-income economies were in the bottom-left. Larger bubbles were more common among wealthy countries, but there were exceptions.
CT-A led the chart, with GDP per capita of about $65,000 and an education rate close to 69%. CT-B recorded approximately $57,000 and 65%, followed by CT-C at around $52,000 and 58%. Although CT-K had the second-highest GDP, at roughly $61,000, only about 56% had tertiary qualifications. Nevertheless, it had the largest bubble, showing the highest relative investment in R&D; CT-A also had a particularly large one.
The upper-middle-income group lay mainly in the centre. CT-F had figures of about $33,000 and 41%, compared with approximately $37,000 and 49% for CT-E and $45,000 and 50% for CT-D. CT-J was richer, at $50,000 per person, but its attainment rate was lower, at around 46%. Among lower-middle-income countries, CT-L and CT-I had the lowest GDP and education levels. CT-G reached around $29,000 and 35%, while CT-H combined a lower GDP of about $22,000 with a higher attainment figure of 40%. CT-H’s relatively large bubble contrasted with the very small bubbles for CT-L and CT-I.
Part 1 · Band 7 Sample Answer
The bubble chart compares twelve countries in 2022. It shows GDP per capita and the percentage of 25–34-year-olds with tertiary education. Bubble size represents R&D expenditure as a share of GDP, while shading indicates three income groups.
Overall, higher GDP was generally connected with higher education levels. High-income countries had the highest figures for both measures, whereas lower-middle-income countries usually had the lowest. Wealthier countries also tended to have larger R&D bubbles, although there were some exceptions.
CT-A had the highest GDP per person, at around $65,000, and the highest education rate, at about 69%. CT-B followed at roughly $57,000 and 65%. CT-C recorded approximately $52,000 and 58%, while CT-K had $61,000 and 56%. CT-K had the largest bubble in the chart, followed by CT-A.
The upper-middle-income countries were positioned between the other groups. CT-F recorded about $33,000 and 41%, while CT-E and CT-D had education rates close to 49% and 50% respectively. CT-J had the highest GDP in this group, at around $50,000, but its education figure was lower, at 46%. Among lower-middle-income countries, CT-L had the lowest values, at approximately $13,000 and 27%. CT-I stood at $20,000 and 29%, and CT-G at $29,000 and 35%. CT-H was unusual because its education rate reached 40% despite GDP of only around $22,000. Its R&D bubble was also much larger than those of the other countries in its group.