Task 1 · Dynamic Multiple-Line Graph
You should spend about 20 minutes on this task. Write at least 150 words.
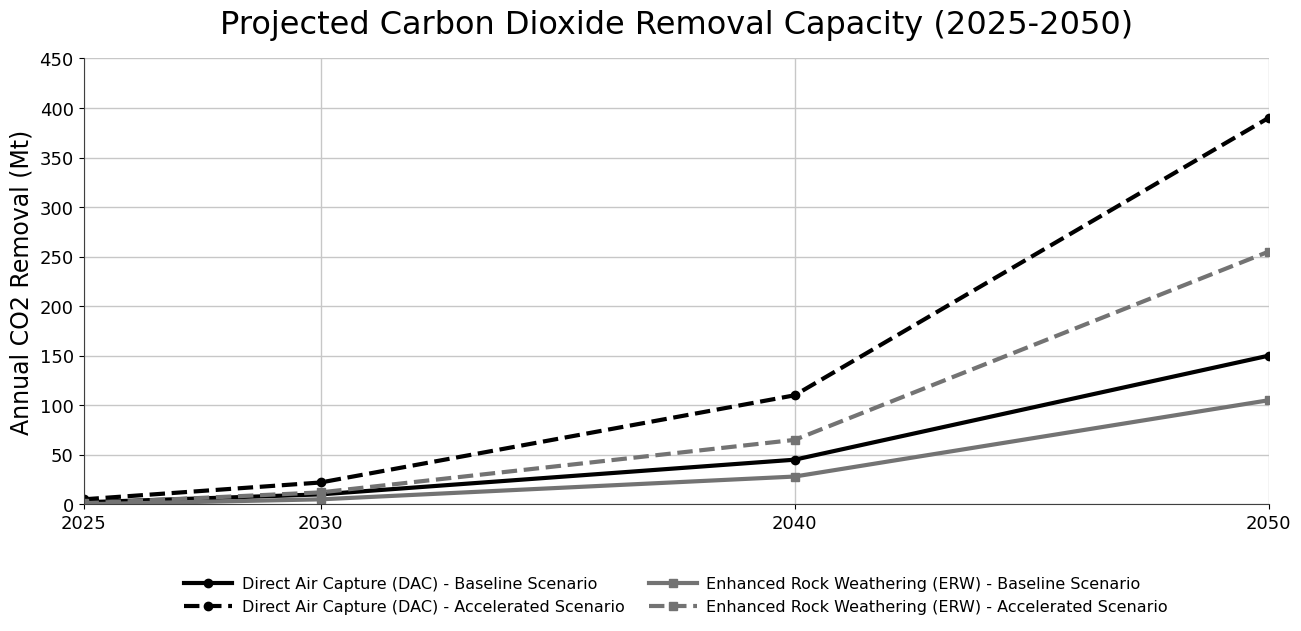
The graph below shows the projected annual carbon dioxide removal capacity of two technologies—Direct Air Capture (DAC) and Enhanced Rock Weathering (ERW)—under two different policy scenarios (Baseline and Accelerated) from 2025 to 2050.
Summarise the information by selecting and reporting the main features, and make comparisons where relevant.
Want to see your estimated band score?
Check your writing scorePart 1 · Band 9 Sample Answer
The line graph compares the projected annual carbon dioxide removal capacity of Direct Air Capture and Enhanced Rock Weathering between 2025 and 2050 under baseline and accelerated policy scenarios. Capacity is measured in millions of tonnes.
Overall, all four projections rise throughout the period, with growth expected to be particularly rapid after 2040. DAC is forecast to outperform ERW under the equivalent policy setting, while accelerated policies produce substantially greater capacity than the baseline in both cases. By 2050, accelerated DAC is projected to be the dominant option by a considerable margin.
In 2025, the removal capacities of both technologies are expected to be negligible under either scenario. By 2030, accelerated DAC is forecast to reach approximately 25 Mt annually, compared with about 10 Mt under the baseline. The equivalent ERW figures are lower, at roughly 15 Mt and 5 Mt respectively. These differences become more pronounced by 2040, when DAC capacity is predicted to stand at 110 Mt with accelerated action and 45 Mt without it. ERW is projected to reach around 65 Mt and 30 Mt.
During the final decade, capacity increases sharply across all categories. Accelerated DAC is anticipated to climb by 280 Mt to approximately 390 Mt in 2050, while accelerated ERW reaches about 255 Mt. The baseline estimates remain much lower, at 150 Mt for DAC and just over 100 Mt for ERW. Notably, however, accelerated ERW is expected to exceed baseline DAC from 2040 onwards.
Part 1 · Band 8 Sample Answer
The graph illustrates predicted changes in the annual carbon dioxide removal capacity of Direct Air Capture and Enhanced Rock Weathering from 2025 to 2050. For each technology, projections are provided for baseline and accelerated policy scenarios, with capacity expressed in Mt.
Overall, removal capacity is expected to increase for every category, especially between 2040 and 2050. DAC remains ahead of ERW when the same policy scenario is compared, and accelerated policies lead to far higher results than baseline policies. The accelerated DAC projection is the highest throughout and reaches almost 400 Mt by the end of the period.
All four figures begin at very low levels in 2025. In 2030, DAC is forecast to remove about 10 Mt annually under the baseline scenario, rising to approximately 25 Mt with accelerated policies. ERW is expected to achieve lower capacities of around 5 Mt and 15 Mt respectively. By 2040, the two DAC projections increase to roughly 45 Mt and 110 Mt. In comparison, ERW is predicted to reach about 30 Mt under baseline policies and 65 Mt under accelerated ones.
Much larger gains are forecast over the following decade. By 2050, baseline DAC capacity is expected to reach 150 Mt, compared with just over 100 Mt for baseline ERW. Under accelerated policies, the figures rise to approximately 390 Mt for DAC and 255 Mt for ERW. Thus, accelerated ERW alone is projected to have a considerably greater capacity than either technology achieves in the baseline scenario.
Part 1 · Band 7 Sample Answer
The line graph shows the projected amount of carbon dioxide that Direct Air Capture and Enhanced Rock Weathering will remove each year between 2025 and 2050. Both technologies are shown under baseline and accelerated policy scenarios, and the figures are measured in Mt.
Overall, the capacity of both technologies is predicted to rise in each scenario. Accelerated policies are expected to produce much higher figures than baseline policies, particularly towards 2050. DAC is also forecast to remove more carbon dioxide than ERW when they are compared under the same scenario.
In 2025, all four removal figures are close to zero. By 2030, DAC is expected to reach about 10 Mt under the baseline scenario and 25 Mt under the accelerated one. The figures for ERW are lower, at approximately 5 Mt and 15 Mt respectively. In 2040, baseline DAC is predicted to increase to around 45 Mt, while accelerated DAC reaches 110 Mt. ERW is forecast to provide about 30 Mt of baseline capacity and 65 Mt with faster policy action.
The most significant increases are expected during the final ten years. Baseline DAC is projected to rise to 150 Mt in 2050, compared with just over 100 Mt for baseline ERW. Meanwhile, accelerated DAC climbs to roughly 390 Mt, making it the highest figure on the chart. Accelerated ERW also grows strongly to approximately 255 Mt, which is well above both baseline projections.