Task 1 · Dynamic Mixed Chart
You should spend about 20 minutes on this task. Write at least 150 words.
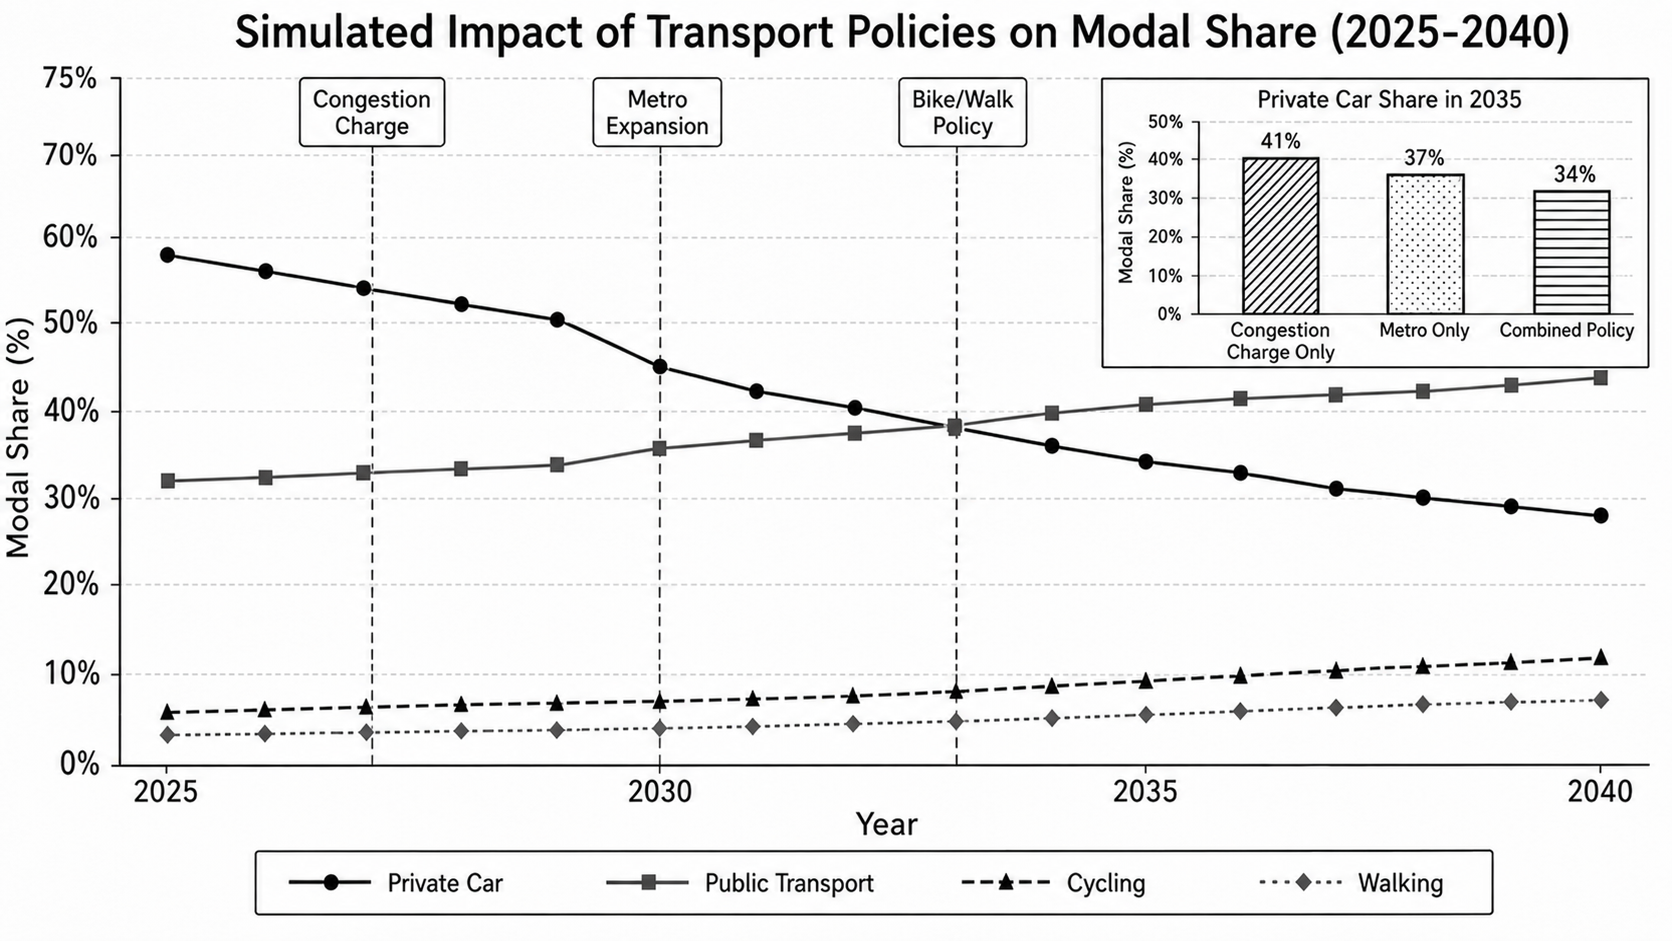
The chart below shows projected changes in the modal shares of four selected types of urban transport in a metropolitan city from 2025 to 2040, following the introduction of three transport policies. The inset chart compares the projected private car share in 2035 under three policy scenarios.
Summarise the information by selecting and reporting the main features, and make comparisons where relevant.
Want to see your estimated band score?
Check your writing scorePart 1 · Band 9 Sample Answer
The main chart traces the forecast journey shares for private car, public transport, bicycle and walking from 2025 to 2040, alongside the introduction of a congestion charge in 2027, metro expansion in 2030 and a cycling and walking policy in 2033. The inset compares car use in 2035 under three policy combinations.
Overall, private cars are expected to lose their dominant position as their share falls continuously, whereas public transport rises and overtakes them at around the 2033 policy point. Cycling and walking also gain ground, though both remain minor modes. For 2035, combining the policies produces the lowest projected car share.
In 2025, cars account for approximately 58% of travel, far ahead of public transport at 32%. By 2029, these figures move to 50% and 34% respectively. The gap then closes much faster around the metro expansion: car use drops to 45% in 2030 and about 38% in 2033, while the public transport share climbs to roughly 36% and 38%. Thereafter, the two trends diverge, with public transport reaching around 44% by 2040 and cars falling to approximately 28%.
Cycling increases gradually from 6% in 2025 to about 8% in 2033, before rising more noticeably to 12% at the end. Walking follows a gentler upward path, from roughly 3% to 7%. The inset shows that cars would represent 41% of journeys in 2035 with the congestion charge alone, compared with 37% under metro expansion alone and 34% under the combined policy, seven percentage points below the first scenario.
Part 1 · Band 8 Sample Answer
The charts present projections for the percentage of urban journeys made by four forms of transport from 2025 to 2040. They also mark three policy introductions, while the smaller chart shows how different policy scenarios are expected to affect private car use in 2035.
Overall, the share of private cars is predicted to decline substantially, while public transport becomes increasingly popular and eventually takes the lead. Cycling and walking both rise, but continue to account for much smaller proportions. In addition, the combined policy is forecast to reduce car use more than either single-policy scenario shown.
At the beginning, private cars make up about 58% of journeys, compared with 32% for public transport. Car use then decreases to 54% when the congestion charge starts in 2027 and to 45% at the point of metro expansion in 2030. Meanwhile, the public transport figure edges up to around 33% in 2027 before reaching 36% in 2030. The two modes stand at almost the same level, approximately 38%, in 2033. By 2040, public transport has risen to roughly 44%, whereas the car share has dropped to about 28%.
The less common modes show steadier growth. Cycling rises from around 6% in 2025 to 8% in 2033, then continues upwards to 12% by 2040. Walking increases from approximately 3% to 7% over the whole period. Looking specifically at 2035, the projected private car share is 41% with only the congestion charge, 37% with only metro expansion, and 34% when the policies are combined.
Part 1 · Band 7 Sample Answer
The line chart shows the predicted shares of four kinds of transport in a metropolitan city between 2025 and 2040. It also indicates when three transport policies are introduced. The smaller bar chart compares the expected percentage of private car journeys in 2035 under three different scenarios.
Overall, private car use is forecast to fall throughout the period, while public transport follows the opposite trend. The two shares become equal at about 38% in 2033, after which public transport is the leading mode. Cycling and walking also increase, although their proportions remain relatively low. The combined policy gives the smallest car share in 2035.
In 2025, around 58% of journeys are made by private car, compared with 32% by public transport. The car figure falls steadily to 54% in 2027, when the congestion charge is introduced, and then reaches 45% in 2030, the year of the metro expansion. It continues to decline to about 28% by 2040. In contrast, public transport rises slowly at first, from 32% to 36% between 2025 and 2030, before growing to approximately 44% at the end.
Cycling accounts for about 6% of journeys initially and increases to around 8% in 2033, when the bike and walking policy begins. It then reaches 12% in 2040. Walking grows more gradually, from roughly 3% to 7%. In 2035, private cars are projected to represent 41% of journeys under the congestion charge alone, 37% under the metro-only scenario, and 34% under the combined policy.