Task 1 · Static Mixed Chart
You should spend about 20 minutes on this task. Write at least 150 words.
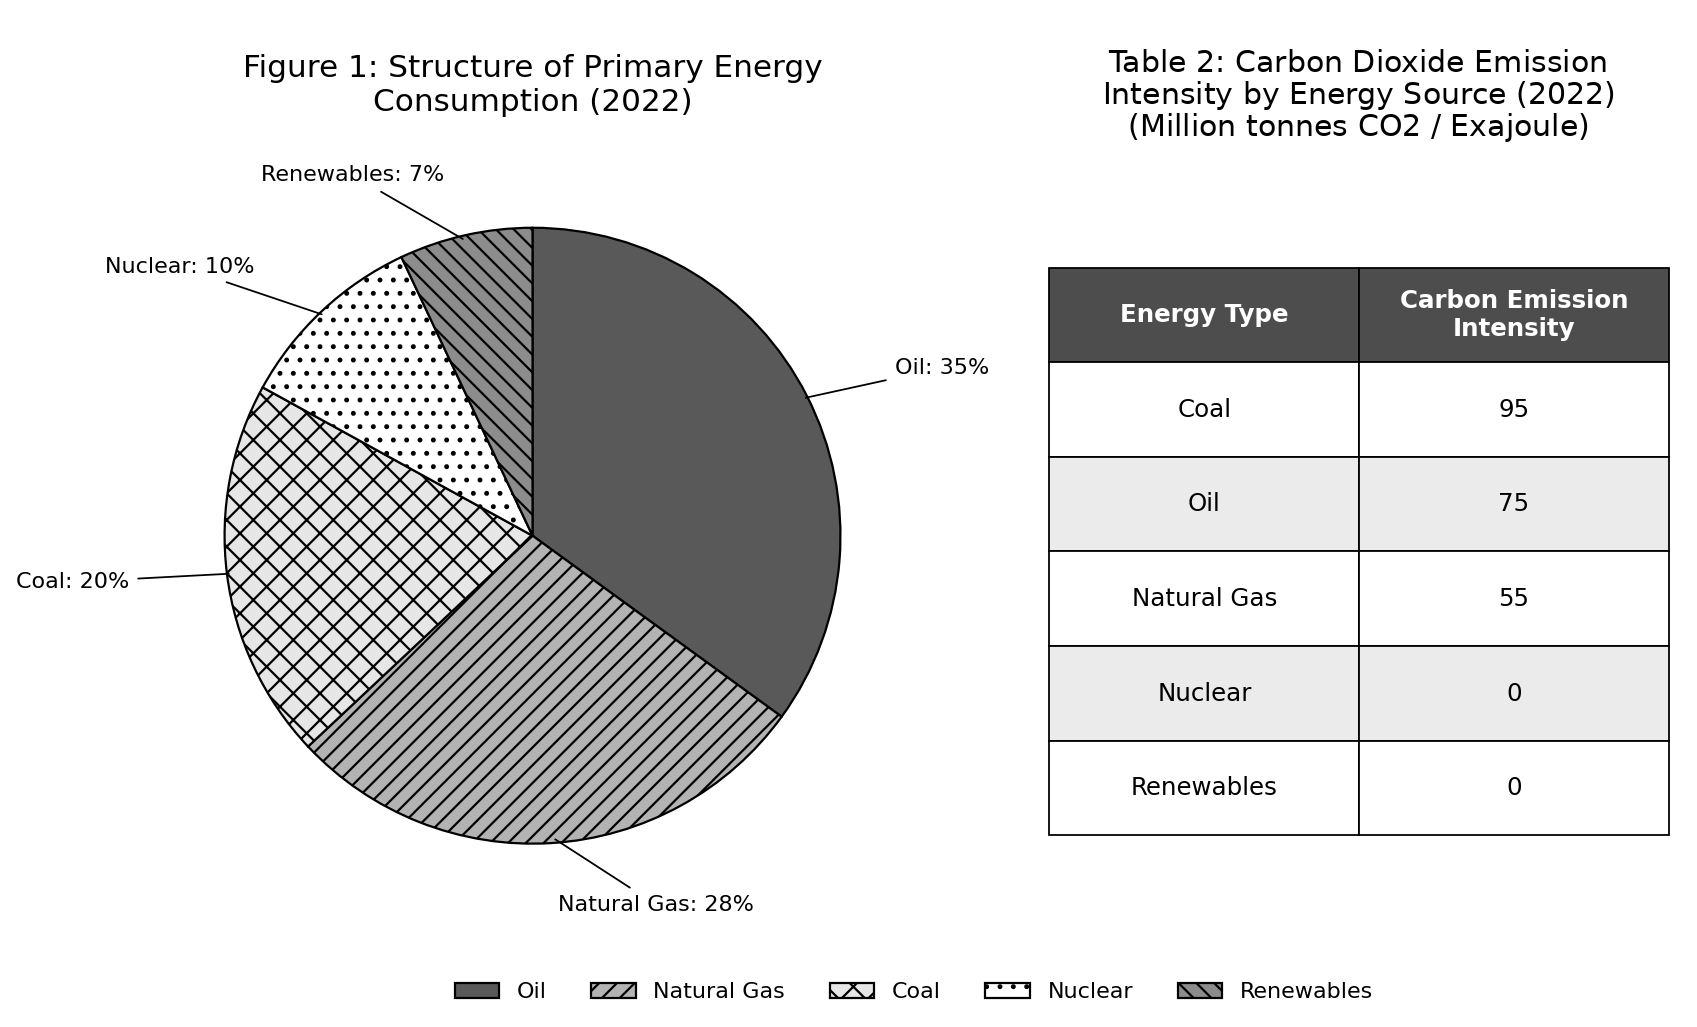
The pie chart and table below show primary energy consumption by source and the carbon dioxide emission intensity of each source in a country in 2022.
Summarise the information by selecting and reporting the main features, and make comparisons where relevant.
Want to see your estimated band score?
Check your writing scorePart 1 · Band 9 Sample Answer
The pie chart illustrates the composition of primary energy consumption in a country in 2022, while the table compares the carbon dioxide emission intensity of the five energy sources, measured in million tonnes of CO2 per exajoule.
Overall, fossil fuels overwhelmingly dominated the energy mix, collectively supplying 83% of primary energy. All three were associated with substantial carbon intensity, although the order of their consumption shares differed from their ranking by emissions. By contrast, nuclear power and renewables together accounted for the remaining 17% and recorded no carbon dioxide emissions per unit of energy.
Oil was the largest single source, providing 35% of the country’s primary energy. Natural gas ranked second at 28%, seven percentage points below oil, while coal supplied a further 20%. Among the two non-fossil sources, nuclear power represented 10% of consumption, whereas renewables had the smallest share, at just 7%.
The emissions data present a somewhat different hierarchy. Coal was the most carbon-intensive source, producing 95 million tonnes of CO2 per exajoule, despite ranking only third in consumption. Oil had the second-highest intensity, at 75 million tonnes, while natural gas recorded the lowest figure among the fossil fuels, at 55 million tonnes. Thus, coal’s intensity exceeded that of gas by 40 million tonnes per exajoule and that of oil by 20 million tonnes. Nuclear energy and renewables both had values of zero, sharply distinguishing them from the three sources that dominated overall consumption.
Part 1 · Band 8 Sample Answer
The pie chart shows the percentages of primary energy obtained from five sources in a country in 2022. The accompanying table gives the carbon dioxide emission intensity of each source in million tonnes of CO2 per exajoule.
Overall, oil, natural gas and coal provided the great majority of the country’s energy, with a combined share of 83%. These fossil fuels all produced carbon dioxide, while nuclear power and renewables had an emission intensity of zero. Oil was the most widely consumed source, but coal had the highest emissions per unit of energy.
Oil accounted for 35% of primary energy use, making it the largest category. Natural gas was the second most important source at 28%, followed by coal at 20%. The remaining energy came from nuclear power and renewables, whose shares stood at 10% and 7% respectively. Therefore, the use of oil alone was twice as high as the combined proportion of the two zero-emission sources, which totalled 17%.
In terms of emission intensity, coal recorded the highest figure, at 95 million tonnes of CO2 per exajoule. This was 20 million tonnes above the level for oil, at 75 million tonnes. Natural gas had a lower intensity than the other fossil fuels, producing 55 million tonnes per exajoule, although it was still the second-largest part of the energy mix. In clear contrast, both nuclear power and renewable energy registered no carbon dioxide emissions according to the table, despite together supplying less than one fifth of total consumption.
Part 1 · Band 7 Sample Answer
The pie chart compares the proportions of five sources used for primary energy in a country in 2022, and the table shows their carbon dioxide emission intensity in million tonnes of CO2 per exajoule.
Overall, most of the country’s energy came from fossil fuels. Oil was the largest energy source, followed by natural gas and coal. However, coal produced the most carbon dioxide per unit of energy. Nuclear power and renewables made up much smaller shares and both had zero emission intensity.
Oil supplied 35% of primary energy, while natural gas accounted for 28%. Coal was the third-largest source, representing one fifth of total consumption. Together, these three fossil fuels provided 83% of the country’s energy. Nuclear power contributed 10%, and renewables had the smallest proportion at 7%. The two sources with no carbon dioxide emissions therefore provided a combined total of only 17%.
Coal had an emission intensity of 95 million tonnes of CO2 per exajoule, which was the highest value in the table. Oil ranked second for emissions, with a figure of 75 million tonnes per exajoule. Although natural gas was used more than coal, its emission intensity was considerably lower, at 55 million tonnes. This was 40 million tonnes below coal and 20 million tonnes below oil. In comparison, the values for both nuclear power and renewable energy were zero, creating a clear difference between these sources and the fossil fuels.