Task 1 · Dynamic Pie Chart
You should spend about 20 minutes on this task. Write at least 150 words.
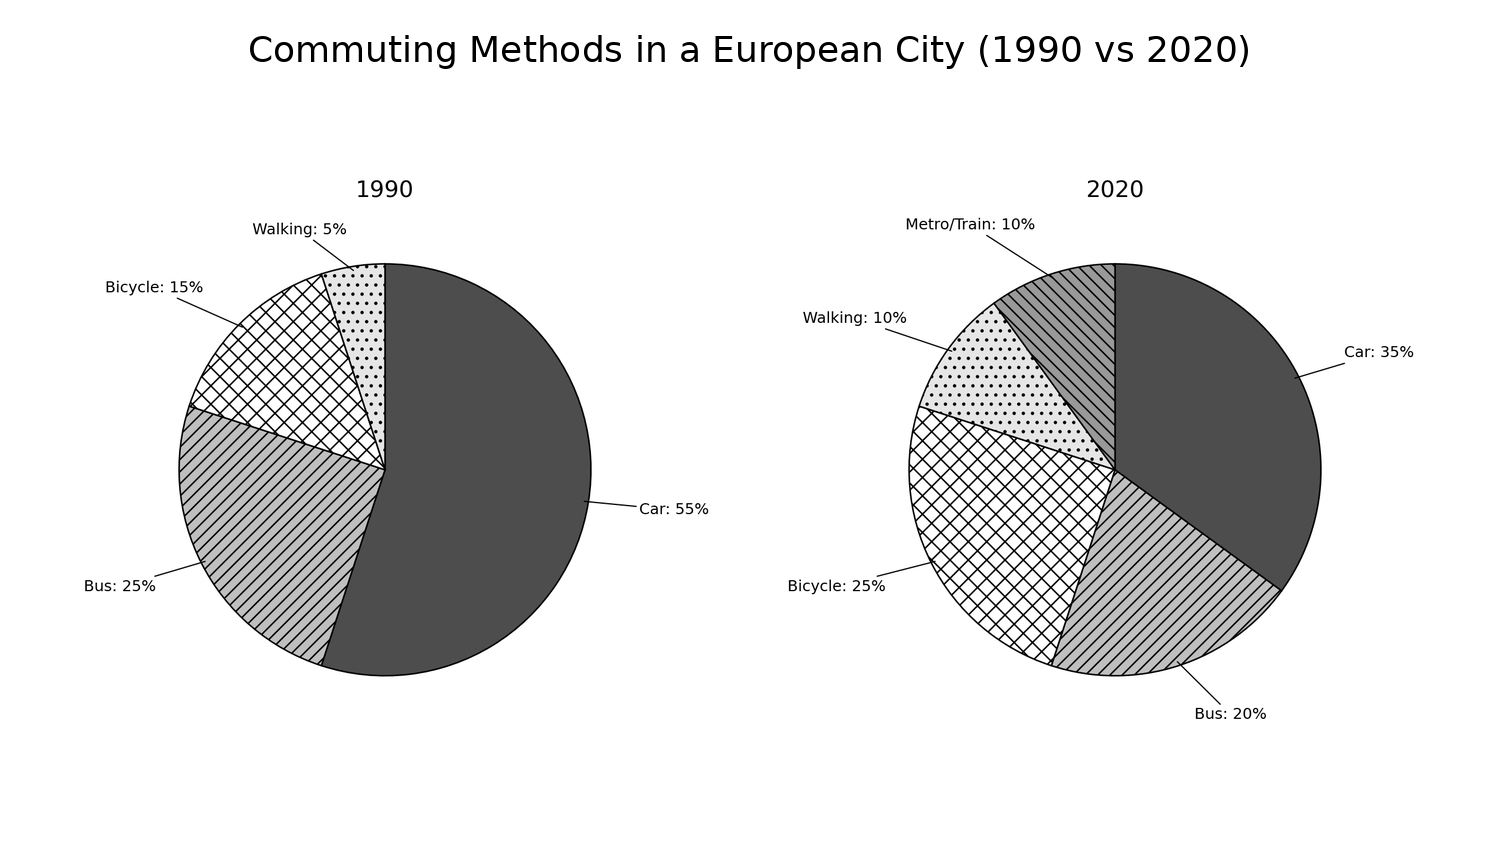
The pie charts below show the main modes of transportation used by people to commute to work in a European city in 1990 and 2020.
Summarise the information by selecting and reporting the main features, and make comparisons where relevant.
Want to see your estimated band score?
Check your writing scorePart 1 · Band 9 Sample Answer
The two pie charts compare the proportions of commuters using the principal forms of transport in a European city in 1990 and 2020.
Overall, the car remained the single most common means of travelling to work, but its dominance diminished markedly over the 30-year period. Commuting became more diversified as cycling and walking gained popularity and metro or train travel emerged as a separate mode, whereas the share using buses declined moderately.
In 1990, a clear majority of commuters, 55%, travelled by car. The bus was a distant second at 25%, while bicycles were used by 15% of workers. Walking was by far the least common option, representing only 5%. Thus, motorised road transport accounted for four fifths of all journeys, and the combined proportion for cycling and walking was just 20%.
By 2020, the car share had fallen by 20 percentage points to 35%, although it still ranked first. Bicycle use, by contrast, rose by 10 points to 25%, overtaking the bus, whose figure slipped to 20%. Walking doubled to 10%, and metro or train services, absent from the 1990 chart, accounted for an identical proportion. Consequently, non-car modes collectively increased from 45% to 65%. Active travel by bicycle or on foot also expanded substantially, from one fifth to 35%, while the two public transport categories together represented 30% of commuting in 2020.
Part 1 · Band 8 Sample Answer
The pie charts illustrate how people in a European city travelled to work in 1990 and 2020, with the figures given as percentages of all commuters.
Overall, cars were the leading form of transport in both years, despite a considerable fall in their share. Meanwhile, bicycle use and walking became more common, and metro or train travel appeared as an additional mode in 2020. Bus use was the only other category to decrease.
In 1990, 55% of people commuted by car, meaning that this method was used by more than half of workers. Buses accounted for a further 25%, making them the second most popular choice. Much smaller proportions travelled actively: 15% cycled and just 5% walked. Cars and buses therefore made up 80% of commuting altogether.
Thirty years later, the proportion using cars had dropped by 20 percentage points to 35%. Although cars continued to rank first, the gap between them and other methods had narrowed. Cycling rose to 25%, an increase of 10 points, and became the second most widely used mode. In contrast, bus travel fell slightly to 20%, placing it third. The percentage walking doubled from 5% to 10%, while metro or train services also accounted for 10% in 2020. Overall, the combined share of cycling and walking climbed from 20% to 35%, showing a clear shift away from reliance on motorised road transport.
Part 1 · Band 7 Sample Answer
The two pie charts show the main types of transport used for journeys to work in a European city in 1990 and 2020.
Overall, the car was the most popular commuting method in both years, but the percentage using it fell significantly. Cycling and walking both became more common, while a new metro or train category appeared in 2020. The proportion travelling by bus decreased slightly.
In 1990, cars were used by 55% of commuters, which was more than all the other methods combined. Buses were the second-largest category, accounting for 25%. Bicycle users represented 15% of workers, whereas only 5% walked to work. As a result, cars and buses together were responsible for 80% of journeys in that year.
By 2020, the share of car users had fallen by 20 percentage points to 35%, although this was still the highest figure. Bicycle use increased from 15% to 25%, making it the second most common method. At the same time, the proportion commuting by bus declined from 25% to 20%. Walking doubled to 10%, and the newly shown metro or train category also made up 10%. Taken together, bicycles, walking and metro or train services accounted for 45% of journeys in 2020. The figures therefore show that commuters relied less heavily on cars and used a wider range of transport methods than they had in 1990.