Task 1 · Static Pie Chart
You should spend about 20 minutes on this task. Write at least 150 words.
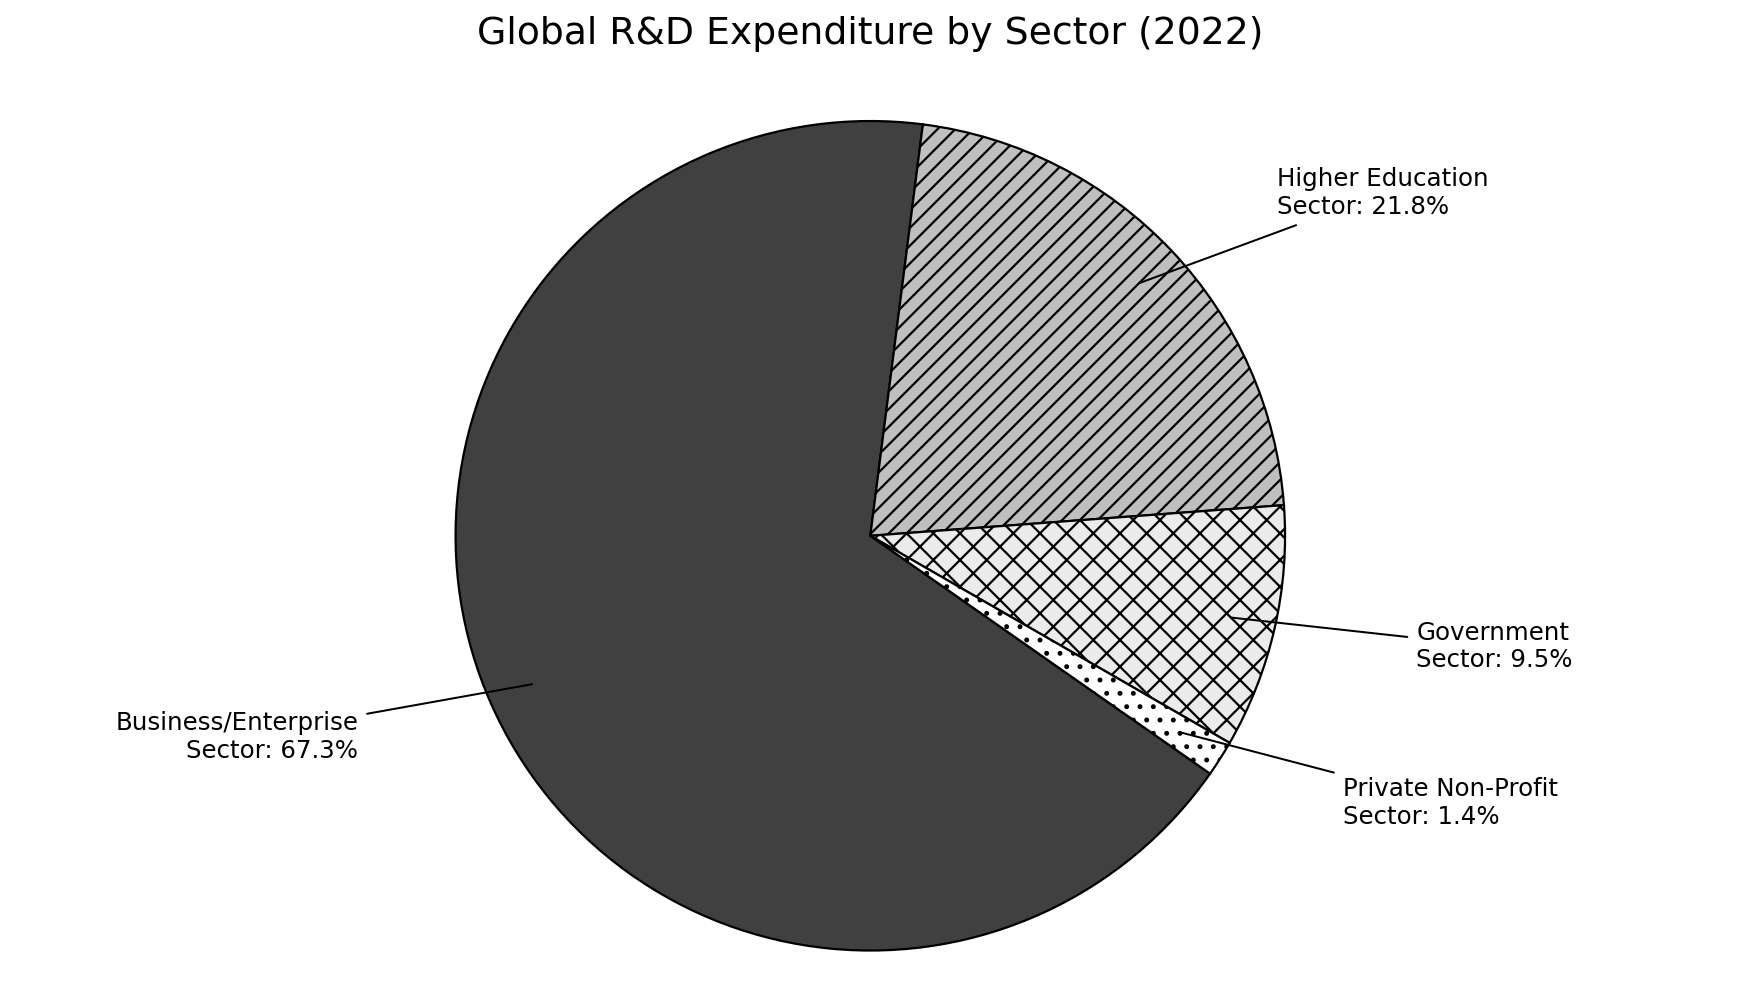
The pie chart below shows the distribution of global research and development (R&D) expenditure by sector in 2022.
Summarise the information by selecting and reporting the main features, and make comparisons where relevant.
Want to see your estimated band score?
Check your writing scorePart 1 · Band 9 Sample Answer
The pie chart illustrates how worldwide expenditure on research and development was divided among the business, higher education, government and private non-profit sectors in 2022.
Overall, R&D spending was overwhelmingly concentrated in business and enterprise, which alone accounted for more than two-thirds of the global total. Higher education ranked a distant second, while government represented less than one-tenth. The private non-profit sector made only a negligible contribution.
More precisely, businesses and enterprises were responsible for 67.3% of all expenditure. This proportion was just over three times the 21.8% attributed to higher education, producing a substantial difference of 45.5 percentage points between the two leading sectors. Together, they comprised 89.1% of global R&D spending, leaving only slightly more than one-tenth for the remaining categories.
The government sector contributed 9.5%, a figure 12.3 percentage points below that of higher education. Private non-profit organisations, by comparison, accounted for merely 1.4%, making their share less than one-sixth of government expenditure and by far the smallest on the chart. Combined, government and private non-profit spending amounted to 10.9%. Notably, the higher education share was exactly double this combined figure, while business expenditure was marginally more than twice the total allocated to all three other sectors.
Part 1 · Band 8 Sample Answer
The chart presents the percentage distribution of global research and development expenditure across four sectors in 2022.
Overall, the business and enterprise sector dominated R&D spending, providing over two-thirds of the total. Higher education was the second-largest contributor, although its share was considerably smaller. Government and private non-profit organisations together accounted for only a relatively small proportion, with the latter contributing the least.
Business and enterprise represented 67.3% of worldwide expenditure on research and development. This was more than three times the proportion recorded for higher education, at 21.8%. The difference between these two sectors was 45.5 percentage points. Taken together, the two largest categories were responsible for 89.1% of total spending.
The government sector accounted for a further 9.5%, which was less than half the percentage contributed by higher education. Its share was nevertheless much greater than that of private non-profit organisations, whose figure was only 1.4%. Government expenditure was therefore almost seven times the private non-profit proportion. The two smallest sectors jointly made up 10.9% of the global total. This combined figure was exactly half the share of higher education and remained far below that of business and enterprise.
Part 1 · Band 7 Sample Answer
The pie chart shows the proportions of worldwide research and development spending provided by four different sectors in 2022.
Overall, the business and enterprise sector accounted for the majority of global R&D expenditure and was clearly the largest category. Higher education was in second place, while government spending formed a much smaller share. Private non-profit organisations had by far the lowest percentage.
The business and enterprise sector made up 67.3% of all spending. In other words, more than two-thirds of the global total came from this category. Higher education contributed 21.8%, which was less than one-third of the business figure. Together, these two leading sectors were responsible for 89.1% of research and development expenditure around the world.
The government sector provided 9.5% of the total. Its proportion was 12.3 percentage points lower than the share for higher education, although it was still much higher than the private non-profit figure. Private non-profit organisations accounted for only 1.4%, meaning that their contribution was less than one-sixth of the government share. The two smaller categories together represented 10.9% of total expenditure. By comparison, the percentage for higher education alone was exactly twice as large as their combined figure, and the business share was more than six times as large.