Task 1 · Static Grouped Bar Chart
You should spend about 20 minutes on this task. Write at least 150 words.
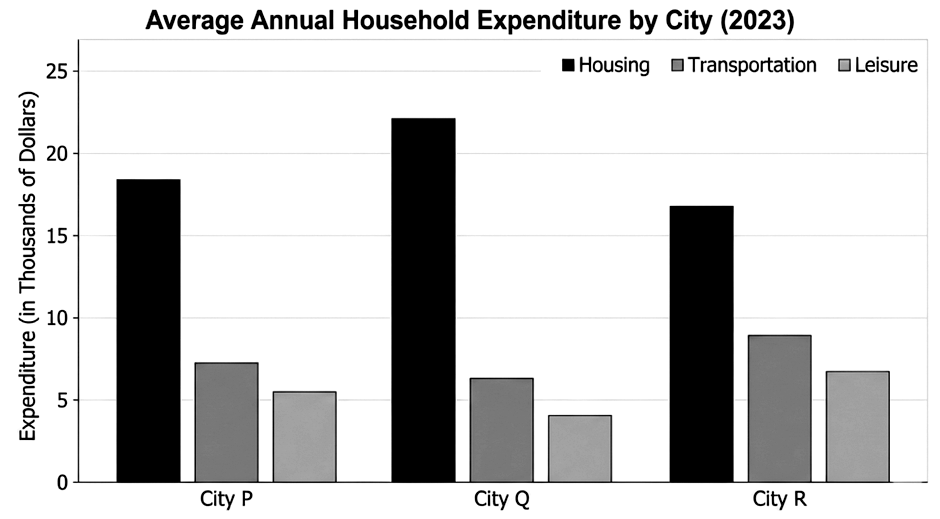
The bar chart below shows the average annual expenditure per household (in thousands of dollars) on three categories in three different cities in 2023.
Summarise the information by selecting and reporting the main features, and make comparisons where relevant.
Want to see your estimated band score?
Check your writing scorePart 1 · Band 9 Sample Answer
The bar chart compares average household spending on housing, transportation and leisure across Cities P, Q and R in 2023, with the figures expressed in thousands of dollars per year.
Overall, housing was by a considerable margin the largest expense in every city. City Q recorded the highest housing expenditure but the lowest leisure figure, whereas households in City R spent the most on both transportation and leisure. Despite these contrasting patterns, total spending across the three categories was remarkably similar in all three places.
In City P, annual housing costs averaged approximately $18,500 per household. This was more than twice the amount allocated to transportation, at just over $7,000, while leisure expenditure was lower again, at around $5,500. The three categories therefore totalled a little above $31,000.
Housing expenditure peaked in City Q at roughly $22,000, exceeding the corresponding figures for Cities P and R by about $3,500 and $5,000 respectively. However, its transportation spending, at approximately $6,300, was the lowest among the three cities, as was its leisure budget of $4,000. City R showed the opposite pattern: although it had the smallest housing figure, at just under $17,000, it led the other cities in transportation and leisure expenditure, at about $9,000 and $6,700. Consequently, the combined total in both Cities Q and R was around $32,000, only marginally above that of City P.
Part 1 · Band 8 Sample Answer
The chart illustrates how much an average household in three cities spent annually on housing, transportation and leisure in 2023. All amounts are shown in thousands of dollars.
Overall, housing represented the greatest expense in each location, although the highest figure was found in City Q. By contrast, City R had the largest budgets for transportation and leisure. The combined expenditure in each city was fairly similar because lower housing costs were generally balanced by higher spending in the other categories.
Households in City P spent about $18,500 per year on housing. Their transportation expenditure was much lower, at a little over $7,000, while approximately $5,500 was used for leisure. This gave City P a total of roughly $31,000 across the three areas.
City Q had the highest housing cost, at around $22,000. However, average spending there was only about $6,300 on transportation and $4,000 on leisure, the lowest leisure figure on the chart. In City R, housing expenditure stood at just under $17,000, making it the smallest of the three housing amounts. Nevertheless, this city ranked first for the remaining categories: households spent approximately $9,000 on transportation and nearly $7,000 on leisure. As a result, total expenditure in Cities Q and R was slightly above $32,000, compared with the somewhat lower overall amount in City P.
Part 1 · Band 7 Sample Answer
The bar chart shows the average amount that households in Cities P, Q and R spent on three types of expenses in 2023. The figures are given in thousands of dollars per year.
Overall, housing was the largest category in all three cities. City Q spent the most on housing, while City R had the highest figures for transportation and leisure. Total expenditure was quite close across the cities despite these differences.
In City P, the average household spent approximately $18,500 on housing. Transportation accounted for just over $7,000, and leisure spending was lower at around $5,500. Housing was therefore more than twice as expensive as either of the other two categories.
The housing figure for City Q was the highest on the chart, at about $22,000. In comparison, transportation spending was roughly $6,300 and only $4,000 was spent on leisure. The pattern was different in City R. Its housing expenditure, at just under $17,000, was the lowest among the cities. However, households there spent about $9,000 on transportation and close to $7,000 on leisure, both of which were the highest figures in their categories. Overall spending in Cities Q and R was a little above $32,000, while the total for City P was just over $31,000.