Task 1 · Dynamic Mixed Chart
You should spend about 20 minutes on this task. Write at least 150 words.
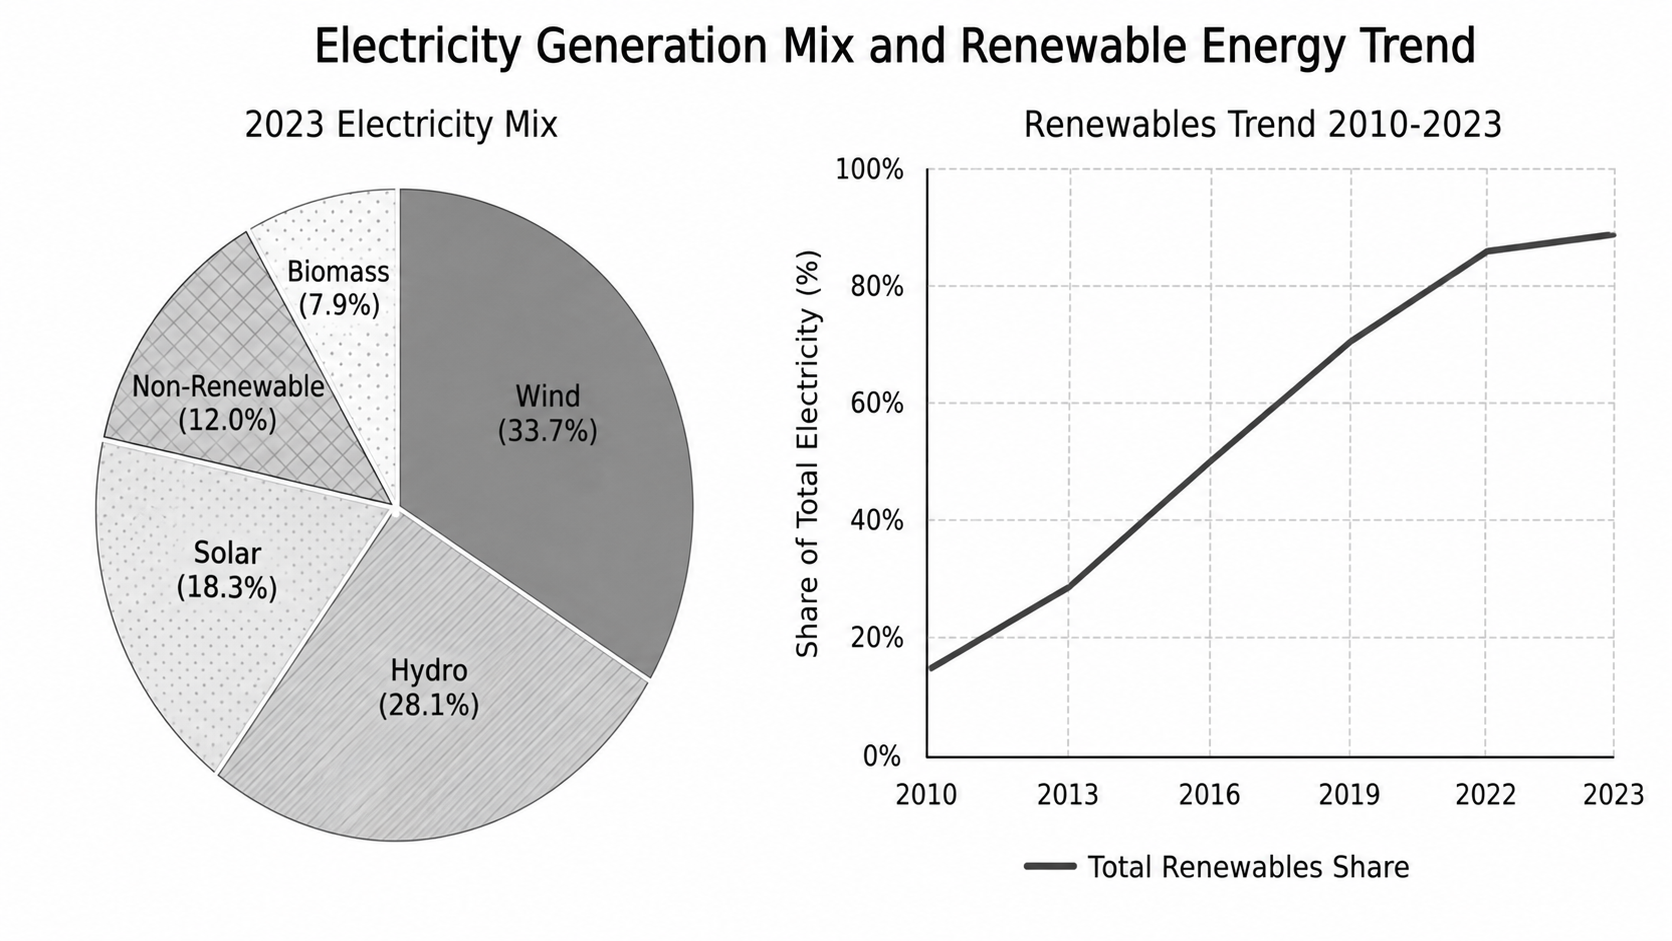
The pie chart and line graph below show the electricity generation mix in a European country in 2023 and the change in the total share of electricity generated from renewable sources between 2010 and 2023.
Summarise the information by selecting and reporting the main features, and make comparisons where relevant.
Want to see your estimated band score?
Check your writing scorePart 1 · Band 9 Sample Answer
The graphics compare the composition of electricity generation in a European nation in 2023 and trace the combined contribution of renewable sources from 2010 to 2023.
Overall, renewables dominated the electricity system by the end of the period, accounting for 88% of generation in 2023. Wind was the largest individual source, followed by hydro, while biomass made the smallest renewable contribution. The total renewable share increased continuously across the period, although its expansion slowed markedly after 2022.
In the 2023 mix, wind supplied 33.7% of all electricity, making it approximately 5.6 percentage points more important than hydro, at 28.1%. Together, these two technologies generated 61.8% of the total. Solar contributed a further 18.3%, whereas biomass represented only 7.9%. The four renewable categories therefore added up to exactly 88%, leaving non-renewable generation with the remaining 12%.
The line graph shows that renewable electricity initially accounted for about 15% of output in 2010. This figure almost doubled to roughly 29% by 2013 and then climbed particularly strongly, reaching 50% in 2016 and approximately 70% three years later. By 2022, the proportion had risen to around 86%. Growth was much more limited in the final year, when the share edged up by only about 2 percentage points to 88%. Across the full thirteen-year period, renewables consequently gained approximately 73 percentage points and became the overwhelmingly predominant basis of electricity production.
Part 1 · Band 8 Sample Answer
The pie chart presents the percentage breakdown of electricity production by source in a European country in 2023, while the line graph shows how the overall renewable share changed between 2010 and 2023.
Overall, renewable energy supplied the great majority of electricity in 2023, with wind and hydro together producing well over half of the national total. The share generated from renewables rose throughout the period, increasing most noticeably between 2013 and 2022 before growth became slower in the final year.
Wind was the leading source in 2023, at 33.7%, followed by hydro with 28.1%. Their combined contribution was 61.8%. Solar ranked third and represented 18.3% of generation, more than twice the proportion supplied by biomass, at 7.9%. These four renewable sources jointly accounted for 88% of all electricity, compared with just 12% from non-renewable sources.
Turning to the longer-term trend, renewables made up approximately 15% of total electricity in 2010. Their share rose to just under 30% in 2013 and reached 50% by 2016. It then continued to grow strongly, standing at around 70% in 2019 and roughly 86% in 2022. The upward movement was comparatively small between 2022 and 2023, when the figure increased by about 2 percentage points to 88%. Overall, the renewable share grew by around 73 percentage points, meaning that it was nearly six times its initial level by the end of the period.
Part 1 · Band 7 Sample Answer
The pie chart shows how electricity was generated from five sources in a European country in 2023. The line graph gives the total percentage of electricity from renewable energy between 2010 and 2023.
Overall, renewable sources were responsible for 88% of electricity generation in 2023, while non-renewable energy accounted for only 12%. Wind was the largest source in the mix, and the total renewable share increased steadily over the whole period. However, the increase between 2022 and 2023 was quite small.
In 2023, wind produced 33.7% of the country’s electricity and hydro supplied 28.1%. Together, they made up 61.8% of the total. Solar was the third-largest source, with a share of 18.3%. Biomass contributed 7.9%, making it the smallest renewable category. When these four sources are combined, their total of 88% matches the final figure shown on the line graph.
Renewables provided only about 15% of total electricity in 2010. The figure then increased to approximately 29% in 2013 before reaching 50% in 2016. Growth continued over the next three years, taking the proportion to around 70% in 2019. By 2022, renewable energy represented about 86% of generation. It then rose slightly to 88% in 2023. This means that the overall share increased by roughly 73 percentage points during the thirteen years.