Task 1 · Dynamic Mixed Chart
You should spend about 20 minutes on this task. Write at least 150 words.
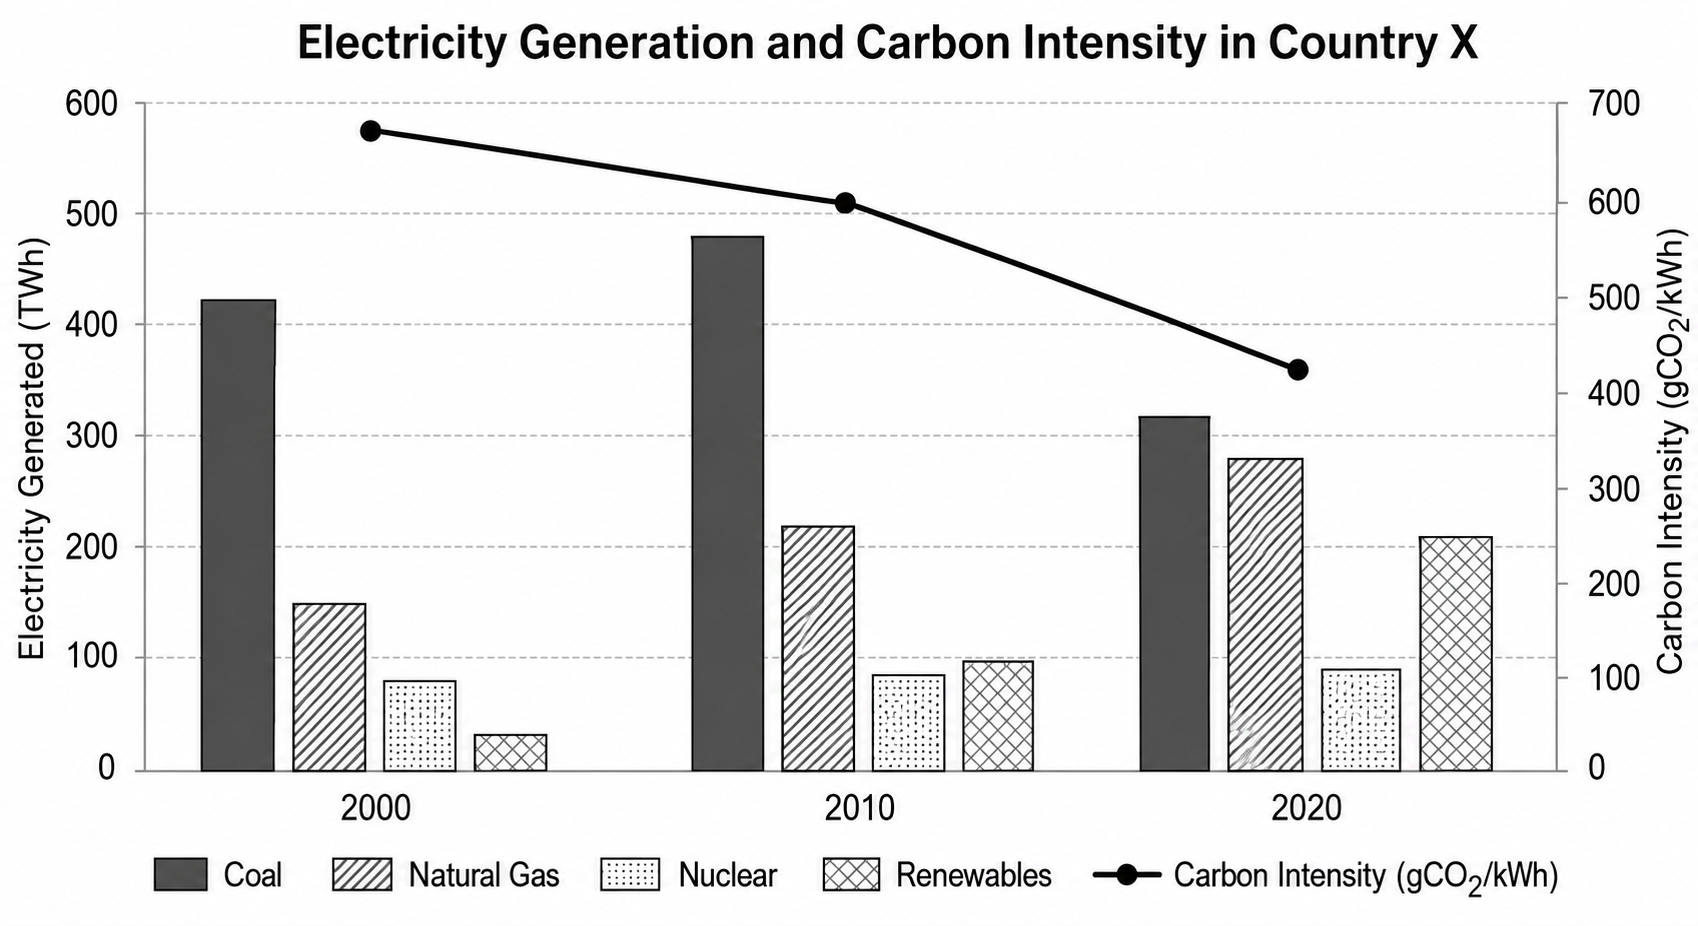
The charts below show the amount of electricity generated (in terawatt-hours) by different energy sources in Country X for the years 2000, 2010, and 2020, and the associated carbon intensity per unit of electricity produced.
Summarise the information by selecting and reporting the main features, and make comparisons where relevant.
Want to see your estimated band score?
Check your writing scorePart 1 · Band 9 Sample Answer
The bar and line charts compare electricity output from coal, natural gas, nuclear power and renewables in Country X in 2000, 2010 and 2020, while also showing the average carbon intensity of the electricity produced.
Overall, coal remained the largest source throughout, although its output fell considerably after reaching a peak in 2010. By contrast, natural gas and especially renewables became increasingly important, whereas nuclear generation changed very little. At the same time, total generation increased and carbon intensity declined, with the sharper reduction occurring in the final decade.
In 2000, coal generated approximately 420 TWh, almost three times the 150 TWh supplied by natural gas. Nuclear power contributed about 80 TWh, while renewables were marginal at only 30 TWh. Coal production subsequently rose to roughly 480 TWh in 2010, and gas output increased by 70 TWh to 220 TWh. Nuclear energy edged up to around 85 TWh, while renewable generation more than tripled to just under 100 TWh.
The pattern shifted markedly by 2020. Coal output dropped to about 320 TWh, narrowing its lead over natural gas, which had climbed to 280 TWh. Renewables recorded the most substantial long-term expansion, reaching approximately 210 TWh, seven times their initial figure, while nuclear power remained broadly stable at around 90 TWh. Meanwhile, carbon intensity decreased from roughly 670 gCO₂/kWh in 2000 to 600 in 2010, before falling much more steeply to about 420 gCO₂/kWh in 2020.
Part 1 · Band 8 Sample Answer
The charts illustrate how much electricity Country X produced from four energy sources in 2000, 2010 and 2020. They also provide information about the carbon intensity of electricity generation in each of these years.
Overall, coal generated more power than any other source in all three years, but its dominance weakened by 2020. Natural gas and renewables both expanded, with the latter experiencing the fastest growth, while nuclear output was largely unchanged. Carbon intensity followed a downward trend despite an overall rise in electricity production.
Coal supplied about 420 TWh in 2000, compared with 150 TWh from natural gas. The figures for nuclear power and renewables were much lower, at approximately 80 and 30 TWh respectively. By 2010, coal generation had risen to a high of around 480 TWh, while gas increased to 220 TWh. Renewable output also grew substantially to almost 100 TWh, overtaking nuclear power, which stood at just over 80 TWh.
By 2020, coal production had fallen sharply to roughly 320 TWh. In contrast, natural gas continued to rise and reached 280 TWh, leaving only a relatively small difference between the two fossil fuels. Renewables more than doubled from their 2010 level to around 210 TWh, whereas nuclear power increased only slightly to about 90 TWh. Carbon intensity fell from approximately 670 gCO₂/kWh in 2000 to 600 gCO₂/kWh ten years later, and then declined more noticeably to about 420 gCO₂/kWh in 2020.
Part 1 · Band 7 Sample Answer
The bar chart compares the amount of electricity generated from coal, natural gas, nuclear power and renewable sources in Country X in three years. The line shows the carbon intensity of the electricity supply.
Overall, coal was the main source of electricity in every year, although its output was lower in 2020 than in the two earlier years. Natural gas and renewable energy became more important over time, while the nuclear figure changed only slightly. Carbon intensity decreased throughout the period.
In 2000, coal produced about 420 TWh of electricity. This was far higher than the amounts generated from natural gas and nuclear power, at 150 TWh and around 80 TWh respectively. Renewables made the smallest contribution, producing only about 30 TWh. In 2010, coal output increased to approximately 480 TWh, its highest level on the chart. Natural gas also rose to 220 TWh, while renewable production reached nearly 100 TWh and moved above nuclear power.
The situation was different in 2020. Electricity from coal fell to around 320 TWh, while the natural-gas figure grew to 280 TWh. Renewable output continued to increase strongly and reached about 210 TWh, but nuclear generation remained close to 90 TWh. The carbon intensity of electricity production declined from roughly 670 gCO₂/kWh in 2000 to 600 gCO₂/kWh in 2010. It then fell more rapidly, reaching approximately 420 gCO₂/kWh by 2020.