ACADEMIC WRITING SAMPLE ANSWERS

Academic Writing Sample Answers Practice 12 Test 03

This original practice page includes Task 1 (Static Mixed Chart) and Task 2 (Agree or Disagree Essay), with Band 9, Band 8, and Band 7 sample answers for IELTS preparation.
Academic Writing Task 1

Task 1 · Static Mixed Chart

Task 1 Prompt

You should spend about 20 minutes on this task. Write at least 150 words.

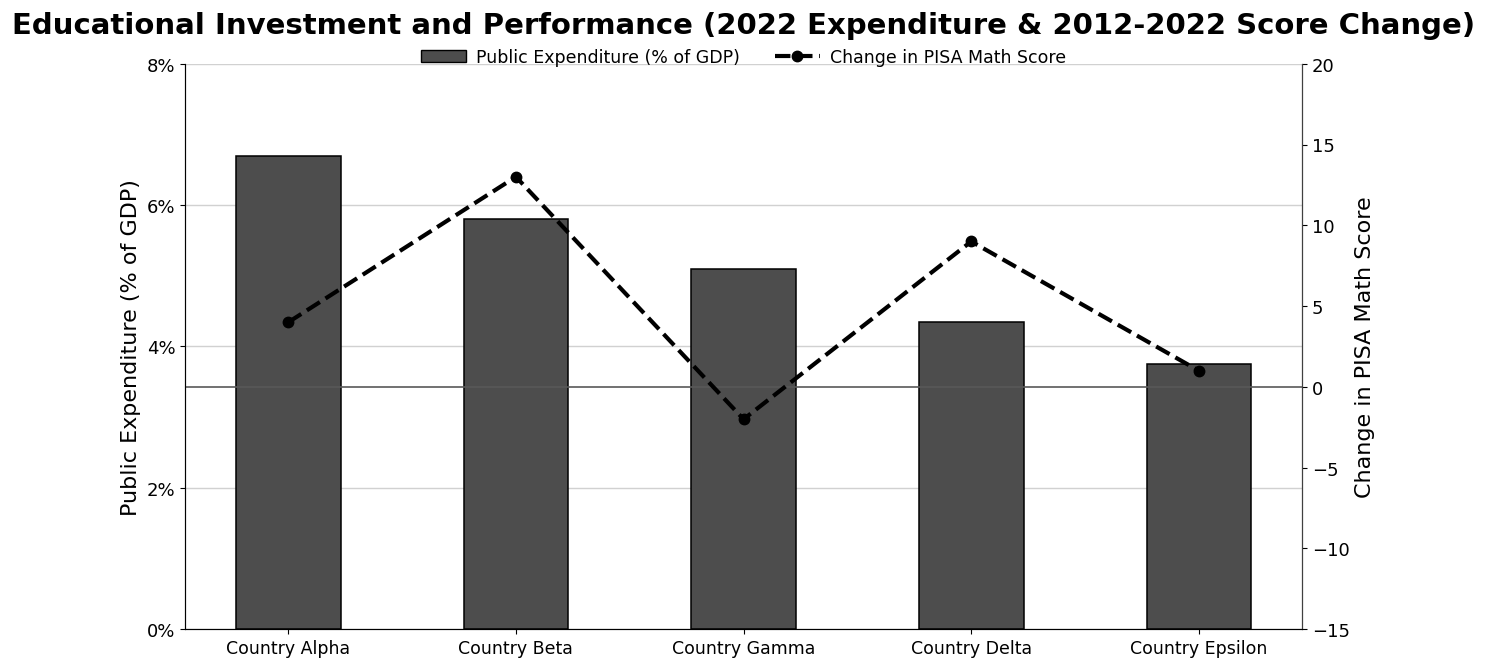
The bar chart and line graph below compare the total public expenditure on education (as a percentage of GDP) for five countries in 2022, and the change in their average PISA scores in mathematics over the period 2012 to 2022.

Summarise the information by selecting and reporting the main features, and make comparisons where relevant.
Academic Writing Task 1 Static Mixed Chart practice image
BAND 9

Part 1 · Band 9 Sample Answer

The combined bar and line chart compares public spending on education in five countries in 2022, expressed as a proportion of GDP, and shows how their average PISA mathematics scores changed between 2012 and 2022.

Overall, the countries formed a steadily descending order in terms of expenditure, with Alpha allocating the largest share of GDP and Epsilon the smallest. Changes in mathematical performance, however, followed no comparable pattern. Beta recorded by far the greatest improvement, while Gamma was the only country whose average score declined.

Country Alpha devoted approximately 6.7% of GDP to education, around 0.9 percentage points more than Beta, at 5.8%. The proportions were progressively lower in Gamma and Delta, at roughly 5.1% and 4.3% respectively. Epsilon ranked last, although its figure of about 3.7% was only 0.6 percentage points below that of Delta. Overall, the difference between the highest and lowest spenders was approximately three percentage points.

Despite ranking second for expenditure, Beta achieved the strongest gain in PISA mathematics, with its average score rising by about 13 points over the decade. Delta also performed notably well, recording an increase of roughly 9 points despite relatively modest spending. By comparison, Alpha, the highest spender, experienced a rise of only around 4 points. Epsilon registered the smallest positive change, at approximately one point, whereas Gamma saw its score decrease by about 2 points even though its expenditure was close to the middle of the range.

BAND 8

Part 1 · Band 8 Sample Answer

The chart presents information about educational expenditure in five countries in 2022 and changes in their average PISA mathematics results from 2012 to 2022. Spending is measured as a percentage of GDP, while performance is shown as the number of points gained or lost.

Overall, Alpha spent the largest proportion of its GDP on education and Epsilon the smallest. However, higher expenditure was not always linked to a greater improvement in mathematics scores. Beta experienced the largest increase, whereas Gamma was the only country to record a fall.

Public spending stood at approximately 6.7% of GDP in Alpha. Beta followed at about 5.8%, and Gamma allocated just over 5%. The corresponding proportions for Delta and Epsilon were lower, at roughly 4.3% and 3.7% respectively. Therefore, expenditure decreased consistently from Alpha to Epsilon, with a gap of around three percentage points between the two ends of the ranking.

The pattern for PISA score changes was much less regular. Beta achieved an increase of around 13 points, the highest figure among the five countries. Delta recorded the next strongest result, gaining approximately 9 points even though it was the second-lowest spender. Alpha saw a more moderate improvement of about 4 points. At the other end of the scale, Epsilon gained only around one point, while Gamma was the sole country with a negative outcome, as its average score fell by approximately 2 points. Thus, Alpha and Gamma spent relatively large shares of GDP without producing the strongest score improvements.

BAND 7

Part 1 · Band 7 Sample Answer

The bar chart compares the percentage of GDP spent on education by five countries in 2022. The line graph shows the change in their average PISA mathematics scores between 2012 and 2022.

Overall, Country Alpha had the highest level of public education spending, while Country Epsilon had the lowest. In contrast, Country Beta showed the greatest improvement in its mathematics score. Country Gamma was the only nation where the score went down, suggesting that the countries with higher spending did not always achieve larger gains.

Alpha spent about 6.7% of its GDP on education. This was followed by Beta at approximately 5.8% and Gamma at just over 5%. The figures for Delta and Epsilon were lower, at around 4.3% and 3.7% respectively. As a result, Alpha spent about three percentage points more of its GDP than Epsilon.

In terms of performance, Beta had the largest rise in its average PISA mathematics score, at roughly 13 points. Delta also achieved a considerable improvement of about 9 points despite having relatively low expenditure. Alpha recorded a smaller increase of around 4 points. Epsilon, which spent the least, saw its score rise by only approximately one point. Finally, Gamma had a different result from all the other countries: its average score fell by about 2 points over the ten-year period, even though it ranked third for educational spending.

Academic Writing Task 2

Task 2 · Agree or Disagree Essay

Task 2 Prompt

You should spend about 40 minutes on this task. Write at least 250 words.

Write about the following topic:

Some people believe that the most effective method to reduce the consumption of unhealthy food and drinks is to impose significantly higher taxes on them.

To what extent do you agree or disagree?

Give reasons for your answer and include any relevant examples from your own knowledge or experience.

BAND 9

Part 2 · Band 9 Sample Answer

The proposal to place substantially higher taxes on unhealthy food and beverages is based on a simple assumption: as prices rise, consumption falls. While this approach can influence purchasing decisions and should form part of public-health policy, I only partly agree that it is the most effective method. Its impact depends heavily on how products are defined, how consumers respond and what governments do with the revenue.

Taxation has two important strengths. First, price signals operate at the moment of purchase, when people make frequent, often habitual choices. A meaningful levy on drinks containing large quantities of added sugar, for example, can make water or unsweetened alternatives comparatively attractive. It can also influence manufacturers rather than merely consumers. If the tax rises according to sugar or salt content, companies have an incentive to reformulate products so that they enter a lower tax band. This improves the nutritional quality of purchases even when customers remain loyal to familiar brands. Furthermore, the revenue can finance school meals, preventive healthcare or subsidies for fresh food, magnifying the original policy’s benefits.

However, a large tax is neither precise nor sufficient. Labelling a product unhealthy is difficult because portion size, frequency of consumption and an individual’s overall diet all matter. Consumers may also replace a taxed item with an untaxed but equally poor alternative, buy cheaper versions or simply absorb the additional cost. The burden is potentially regressive: the same price increase consumes a larger share of a low-income household’s budget, particularly in areas where affordable fresh food is scarce. Most importantly, taxation does little to address aggressive advertising, limited nutritional knowledge, emotional eating or the convenience advantage of heavily processed products.

A more effective strategy would combine a targeted, graduated tax with measures that reshape the wider food environment. Clear front-of-package information can help shoppers compare products quickly, while restrictions on advertising to children can reduce demand before habits become established. Schools can provide practical food education and nutritious meals, and planning or subsidy policies can make healthy options affordable in underserved neighbourhoods. Tax receipts should fund these interventions rather than disappear into general government spending.

In conclusion, significantly higher taxes can reduce demand and encourage reformulation, so dismissing them would be unwise. Nevertheless, I disagree that taxation by itself is the most effective answer. A carefully designed levy becomes most powerful when combined with education, marketing controls and better access to healthy alternatives.

BAND 8

Part 2 · Band 8 Sample Answer

Many governments are concerned about the amount of food and drink consumed that contains excessive sugar, salt or fat. Raising taxes on these products is often presented as the best way to change behaviour. I agree that higher prices can reduce demand, but I do not consider taxation alone the most effective solution because eating habits are influenced by more than cost.

There is a strong argument for using taxes. When an unhealthy drink becomes noticeably more expensive, some customers will buy it less often or choose a cheaper and healthier alternative such as water. This effect may be especially important for products purchased regularly, since even a small daily cost becomes significant over time. Taxes can also encourage producers to reduce harmful ingredients. A company may lower the sugar content of a drink to avoid a higher tax rate, meaning that even consumers who continue buying it receive a healthier product. In addition, governments can use the money raised to support public-health programmes.

Despite these benefits, high taxes have limitations. Lower-income families spend a greater proportion of their earnings on food, so the policy may place an unfair burden on them if suitable alternatives are not affordable or locally available. Some consumers may continue buying the same products because of habit, convenience or strong brand preferences. Others might switch to different items that are not taxed but are no healthier. It is also difficult to decide exactly which foods deserve additional taxation. An item can be acceptable in small quantities but harmful when eaten frequently, and a simple tax category may not reflect this difference.

For these reasons, taxation should be combined with other policies. Clear labels on the front of packaging can show high levels of sugar, salt and fat without requiring shoppers to understand complex information. Schools should teach children how to choose and prepare balanced meals, while restrictions can limit the advertising of unhealthy products to young audiences. Healthy food must also become easier to obtain through subsidies, improved school meals and better availability in poorer districts. Revenue from the tax could pay for these measures, making the policy both more effective and fairer.

In conclusion, I partly agree with imposing significantly higher taxes because they can discourage purchases and motivate manufacturers to improve their products. However, taxes are not the most effective method when used in isolation. Lasting reductions in unhealthy consumption require a broader approach that improves knowledge, availability and affordability as well as prices.

BAND 7

Part 2 · Band 7 Sample Answer

Some people argue that governments should place much higher taxes on unhealthy food and drinks because this would reduce their consumption. I partly agree with this view. Higher prices can influence what people buy, but taxation is unlikely to be the most effective method unless it is supported by education and better access to healthy choices.

A higher tax could reduce demand for some unhealthy products. Many people buy sugary drinks, sweets or fast food because they are cheap and convenient. If these items became considerably more expensive, customers might purchase them less frequently or choose alternatives such as water, fruit or home-prepared meals. Taxes could also affect the behaviour of manufacturers. For instance, a drinks company might reduce the amount of sugar in its products in order to avoid the highest tax level. Governments would also receive additional revenue, which could be spent on healthcare or programmes that encourage healthier diets.

However, taxation has several weaknesses. Some people will continue to buy their favourite products even if the price rises, particularly when their choices are based on habit or convenience. Others may move to cheaper products that contain similar amounts of sugar, salt or fat. High taxes may also affect poorer households more severely because food costs represent a larger part of their income. This is especially unfair if fresh food is expensive or if there are few shops selling it in their neighbourhood. Another problem is deciding which products are unhealthy, since the quantity eaten and the rest of a person’s diet are also important.

In my opinion, a combination of methods would produce better results. Food packaging should give simple and clear information so that customers can compare products easily. Schools can teach children about nutrition and provide balanced meals, helping healthy habits develop early. Governments could also restrict advertisements for unhealthy food aimed at children. Finally, fruit, vegetables and other nutritious items should be made more affordable, possibly by using the money collected through the tax. This would give people a realistic alternative instead of only making their current choices more expensive.

In conclusion, significantly higher taxes can play a useful role in reducing unhealthy consumption, and I support them when they are carefully designed. Nevertheless, I disagree that they are the single most effective solution. Education, clear information and affordable healthy food are also necessary for long-term change.

FREE PRACTICE RESOURCES

Download the IELTS Practice PDF Pack.

Get Listening, Reading, and Writing practice materials for self-study. Use a computer to download the 1.9GB pack.

Download PDF Pack
Chat History
My Notes