Task 1 · Static Error Bar Chart
You should spend about 20 minutes on this task. Write at least 150 words.
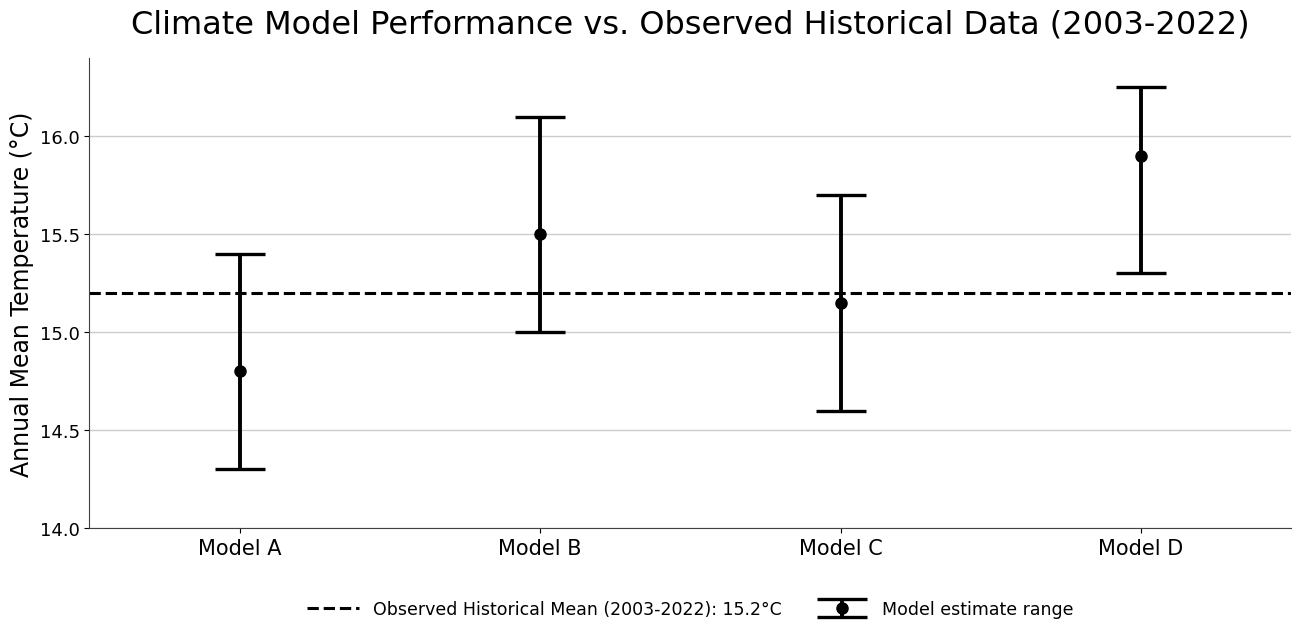
The chart below analyses the performance of four predictive climate models (A-D) against 20 years of observed historical data for annual mean temperature in a region, showing both the average projected temperature and the range of uncertainty for each model.
Summarise the information by selecting and reporting the main features, and make comparisons where relevant.
Want to see your estimated band score?
Check your writing scorePart 1 · Band 9 Sample Answer
The chart evaluates four climate models by comparing their estimates of annual mean temperature with the observed average for the period from 2003 to 2022. It also indicates the uncertainty surrounding each projection.
Overall, Model C produced the estimate closest to the historical mean of 15.2°C, whereas Model D projected the highest temperature and Model A the lowest. Although the uncertainty ranges of Models A, B and C all encompassed the observed figure, the entire range for Model D lay above it. The four intervals were broadly comparable in width, with that of Model D being slightly narrower.
Model A gave a central estimate of approximately 14.8°C, which was 0.4°C below the historical average. Its possible values extended from about 14.3°C to 15.4°C. Model C was considerably more accurate at the central point, estimating roughly 15.15°C. However, its uncertainty remained substantial, ranging between around 14.6°C and 15.7°C.
The other two models indicated warmer conditions than those historically recorded. Model B projected an average of 15.5°C, with lower and upper limits of 15.0°C and 16.1°C respectively. Model D showed the strongest warming projection, placing the mean at roughly 15.9°C. Its range began at about 15.3°C, already marginally above the observed average, and reached approximately 16.25°C. Thus, despite its relatively compact interval, Model D showed the clearest upward deviation from the historical benchmark.
Part 1 · Band 8 Sample Answer
The chart compares the performance of four climate models in estimating annual mean temperature, using the observed average between 2003 and 2022 as a benchmark. Both the central estimate and the uncertainty range are shown for each model.
Overall, the models produced noticeably different average estimates. Model D recorded the highest projected temperature, while Model A had the lowest. Model C was closest to the historical mean of 15.2°C. In addition, the observed figure fell within the ranges of the first three models, but not within that of Model D.
Model A estimated an annual temperature of around 14.8°C, or 0.4°C below the historical level. Its uncertainty interval was fairly wide, stretching from approximately 14.3°C to 15.4°C. Model C also had a broad range, from about 14.6°C to 15.7°C, although its central figure of roughly 15.15°C was almost identical to the actual historical mean.
By contrast, Models B and D both projected temperatures above the benchmark. The estimate for Model B stood at 15.5°C, and its range extended from 15.0°C to 16.1°C. Model D gave a substantially higher central projection of approximately 15.9°C. Even its lower limit, at around 15.3°C, exceeded the observed mean, while the upper limit reached roughly 16.25°C. Its uncertainty range was also slightly narrower than those associated with the other three models.
Part 1 · Band 7 Sample Answer
The chart shows how four climate models performed when their projections of annual mean temperature were compared with the observed average from 2003 to 2022. It presents an estimate and a range of possible values for each model.
Overall, Model D gave the highest estimate, whereas Model A produced the lowest. Model C was the closest to the historical mean of 15.2°C. The observed average was included within the uncertainty ranges for Models A, B and C, while the full range for Model D was above this level.
Model A predicted an average temperature of about 14.8°C. This was 0.4°C lower than the observed figure, and its range ran from roughly 14.3°C to 15.4°C. Model C estimated just under 15.2°C, making it the most accurate model based on the central value. However, its possible results varied considerably, from approximately 14.6°C to 15.7°C.
The other two estimates were higher than the historical average. Model B had a central value of 15.5°C, with a lower limit of 15.0°C and an upper limit of 16.1°C. Model D predicted around 15.9°C, the highest of all four figures. Its uncertainty interval was between about 15.3°C and 16.25°C, so even the lowest possible value remained above the historical mean. This interval was slightly narrower than the ranges shown for the other models.