Task 1 · Dynamic Mixed Chart
You should spend about 20 minutes on this task. Write at least 150 words.
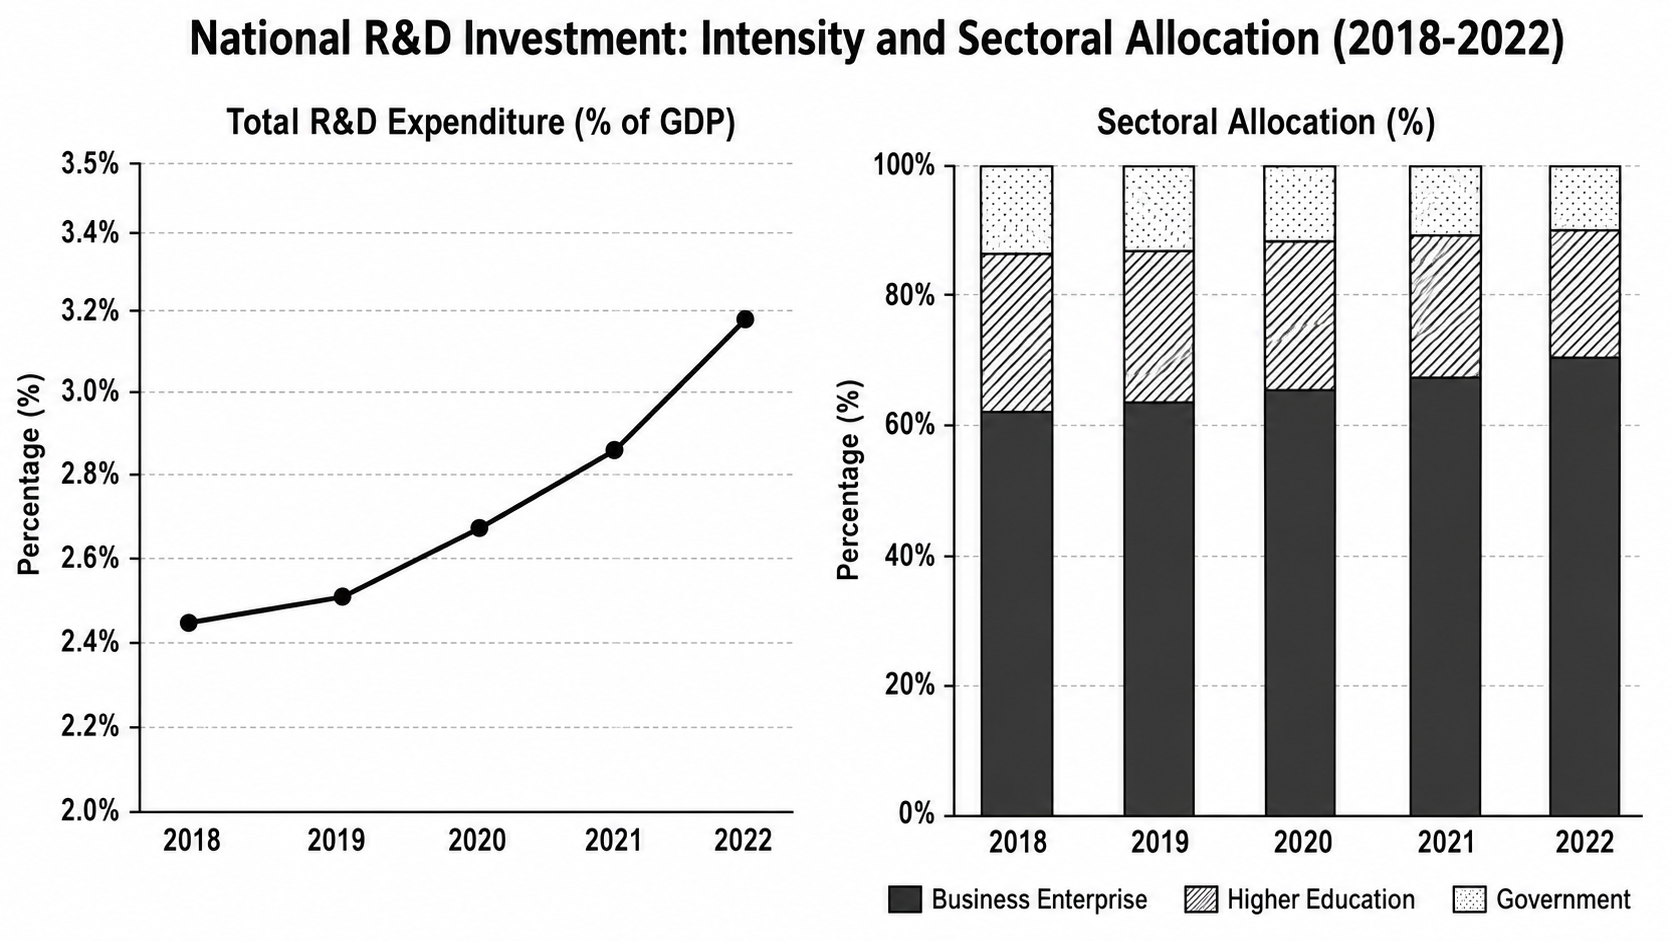
The chart below presents a multi-year analysis of national investment in research and development (R&D), correlating total expenditure as a percentage of GDP with the distribution of funding across three key sectors for the period 2018-2022.
Summarise the information by selecting and reporting the main features, and make comparisons where relevant.
Want to see your estimated band score?
Check your writing scorePart 1 · Band 9 Sample Answer
The two-part chart shows changes in a country’s research and development spending between 2018 and 2022, both as a proportion of GDP and in terms of the percentage allocated to business enterprise, higher education and government.
Overall, R&D expenditure increased throughout the period, and the rise became markedly faster towards the end. Business enterprise received by far the largest allocation in every year and its share grew steadily, whereas the proportions assigned to the other two sectors declined. Government consistently accounted for the smallest component.
Total expenditure initially rose only marginally, from approximately 2.45% of GDP in 2018 to 2.5% in 2019. It then climbed more substantially to about 2.67% in 2020 and 2.85% in 2021, before recording its sharpest annual increase and reaching just under 3.2% in 2022. The overall gain was therefore roughly 0.7 percentage points, most of which occurred after 2019.
Regarding sectoral allocation, the business-enterprise share advanced from around 62% in 2018 to 63% in 2019 and 65% in 2020. It rose further to 67% the following year and 70% by 2022. Higher education, by contrast, represented approximately 24% at the start and remained close to this level in 2019, after which it gradually fell to 20%. Government’s portion declined more uniformly, from 14% to 10%. Consequently, the eight-point expansion in the business share was matched by combined reductions of about four points in each of the other sectors.
Part 1 · Band 8 Sample Answer
The charts compare national expenditure on research and development from 2018 to 2022. The line graph presents spending as a percentage of GDP, while the stacked bars show how the total was allocated among business enterprise, higher education and government.
Overall, the proportion of GDP devoted to R&D rose in every year and increased particularly quickly in 2022. Business enterprise was consistently the main recipient of funding and gained a larger share over time. In contrast, both higher education and government experienced declines in their proportions.
R&D expenditure stood at about 2.45% of GDP in 2018 and edged up to 2.5% in the following year. Growth then became stronger, with the figure reaching roughly 2.67% in 2020 and 2.85% in 2021. By 2022, it had risen sharply to approximately 3.18%, the highest level shown. Overall, this represented an increase of just over 0.7 percentage points.
Business enterprise accounted for around 62% of the allocation in 2018. Its share increased gradually to approximately 63% in 2019, 65% in 2020 and 67% in 2021, before reaching 70% in the final year. Higher education received nearly a quarter of the total in the first two years, but its proportion slipped to about 23% in 2020, 22% in 2021 and 20% in 2022. Government had the smallest allocation throughout, declining steadily from roughly 14% to 10%. Thus, by the end of the period, the business share was three and a half times that of higher education and seven times the government proportion.
Part 1 · Band 7 Sample Answer
The line graph shows national spending on research and development as a percentage of GDP between 2018 and 2022. The bar chart gives the percentage of R&D funding allocated to business enterprise, higher education and government during the same period.
Overall, total R&D spending increased continuously and reached its highest point in 2022. Business enterprise had the largest share in all five years, and this share grew over time. Meanwhile, the percentages for higher education and government both became smaller.
In 2018, R&D expenditure was approximately 2.45% of GDP. It rose slightly to 2.5% in 2019 and then increased to about 2.67% in 2020. The upward trend continued in 2021, when the figure reached roughly 2.85%. The largest rise happened in the final year, taking expenditure to just below 3.2% of GDP.
Business enterprise received about 62% of the funding in 2018, compared with around 24% for higher education and 14% for government. The business proportion rose by one percentage point in 2019 and reached approximately 65% in 2020. It then increased to 67% in 2021 and 70% in 2022. Higher education remained at about 24% in 2019 before falling gradually to 20% by the end of the period. Government funding followed a steady downward pattern, dropping by about one point each year to finish at 10%.