Task 1 · Static Scatter Plot
You should spend about 20 minutes on this task. Write at least 150 words.
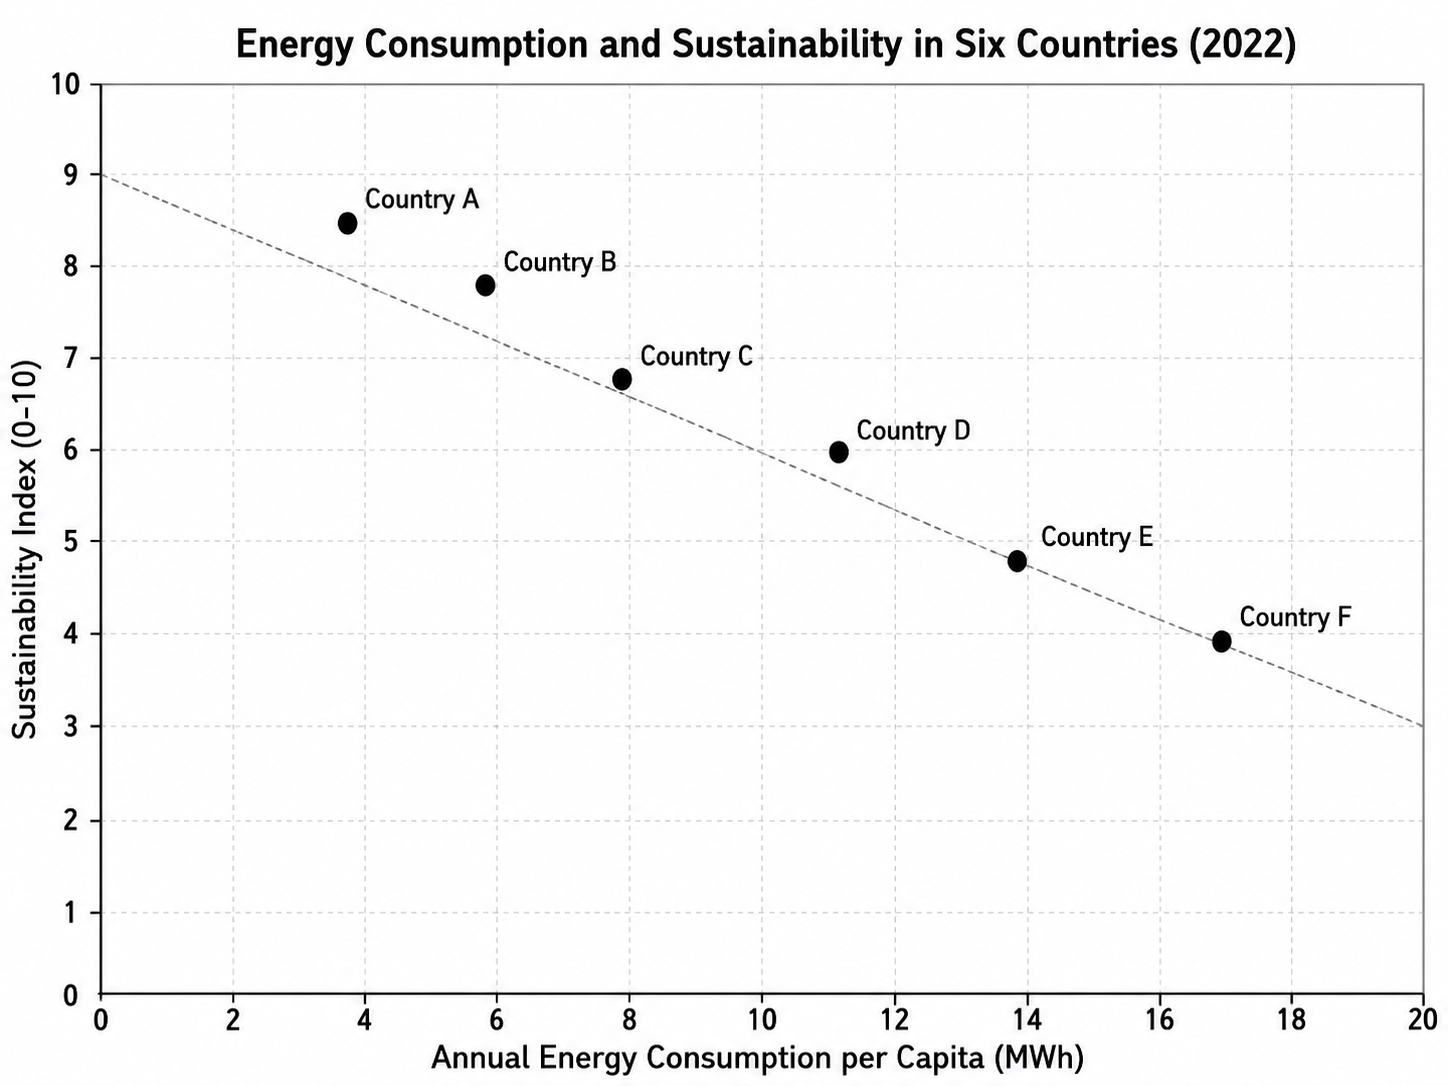
TThe chart below shows the relationship between annual energy consumption per capita and sustainability index scores in six countries in 2022.
Summarise the information by selecting and reporting the main features, and make comparisons where relevant.
Want to see your estimated band score?
Check your writing scorePart 1 · Band 9 Sample Answer
The scatter plot compares per-capita energy use, measured in megawatt-hours, with sustainability ratings on a ten-point scale across six countries in 2022. A fitted line indicates the general relationship between the variables.
Overall, there is a pronounced negative association: every successive increase in energy consumption corresponds to a lower sustainability score. Country A combines the least energy-intensive lifestyle with the highest rating, while Country F occupies the opposite extreme. No country departs substantially from the overall pattern.
At the lower-consumption end, Country A uses just under 4 MWh per person annually and records a sustainability index of approximately 8.5. Country B consumes nearly 6 MWh and scores around 7.8. Country C is situated close to 8 MWh, with its rating falling to roughly 6.8. These three countries all lie slightly above the trend line, although the gap is most noticeable for A and B.
The remaining nations consume considerably more energy and achieve lower scores. Country D uses a little over 11 MWh per capita, almost three times the figure for A, while registering a sustainability rating of about 6.0. Consumption then rises to approximately 14 MWh in Country E as the index drops to 4.8. Finally, Country F has the highest energy use, at around 17 MWh, and the lowest score, just below 4.0. Thus, from A to F, consumption increases by roughly 13 MWh per person while sustainability declines by about 4.5 points.
Part 1 · Band 8 Sample Answer
The chart illustrates the relationship between annual energy consumption per person and sustainability index scores in six countries during 2022. Energy use is given in MWh, while sustainability is rated from zero to ten.
Overall, countries with higher levels of energy consumption consistently have lower sustainability scores. Country A performs best on the index and uses the least energy, whereas Country F has both the greatest consumption and the weakest sustainability result. The six observations remain close to the downward trend line.
Country A consumes slightly below 4 MWh per capita and has the highest sustainability score, at about 8.5. Energy use is higher in Country B, at almost 6 MWh, while its index stands at roughly 7.8. Country C occupies the middle of the lower-consumption group, using around 8 MWh and receiving a score of approximately 6.8.
Among the other three countries, D records annual consumption of just over 11 MWh per person and a sustainability rating of around 6.0. Country E uses approximately 14 MWh, which is about 3 MWh more than D, but scores only 4.8. At the furthest end of the chart, Country F consumes close to 17 MWh and records a sustainability figure of about 3.9. Its energy use is therefore more than four times that of Country A, while its index score is over four points lower. Overall, the rankings of the six nations by the two measures are almost exactly reversed.
Part 1 · Band 7 Sample Answer
The scatter chart shows annual energy consumption per person in six countries in 2022 and compares it with their scores on a sustainability index from zero to ten.
Overall, there is a clear negative relationship between the two measures. Countries that consume more energy per person have lower sustainability scores. Country A has the lowest consumption and the highest index result, while Country F has the highest energy use and the lowest score.
Country A uses just under 4 MWh of energy per person and achieves a sustainability score of about 8.5. Country B consumes nearly 6 MWh, with a lower score of approximately 7.8. The figures for Country C are around 8 MWh and 6.8 respectively. Therefore, even among the three countries with lower energy consumption, the sustainability index falls as energy use increases.
A similar pattern can be seen in the other three nations. Country D consumes slightly more than 11 MWh per person and has a sustainability score of about 6.0. Consumption rises to roughly 14 MWh in Country E, while its index result drops to around 4.8. Country F records the highest energy use, at approximately 17 MWh per capita, and its sustainability score is just below 4. Overall, the difference between Countries A and F is about 13 MWh in energy consumption and approximately 4.5 points on the sustainability index.