Task 1 · Static Multiple Bar Charts
You should spend about 20 minutes on this task. Write at least 150 words.
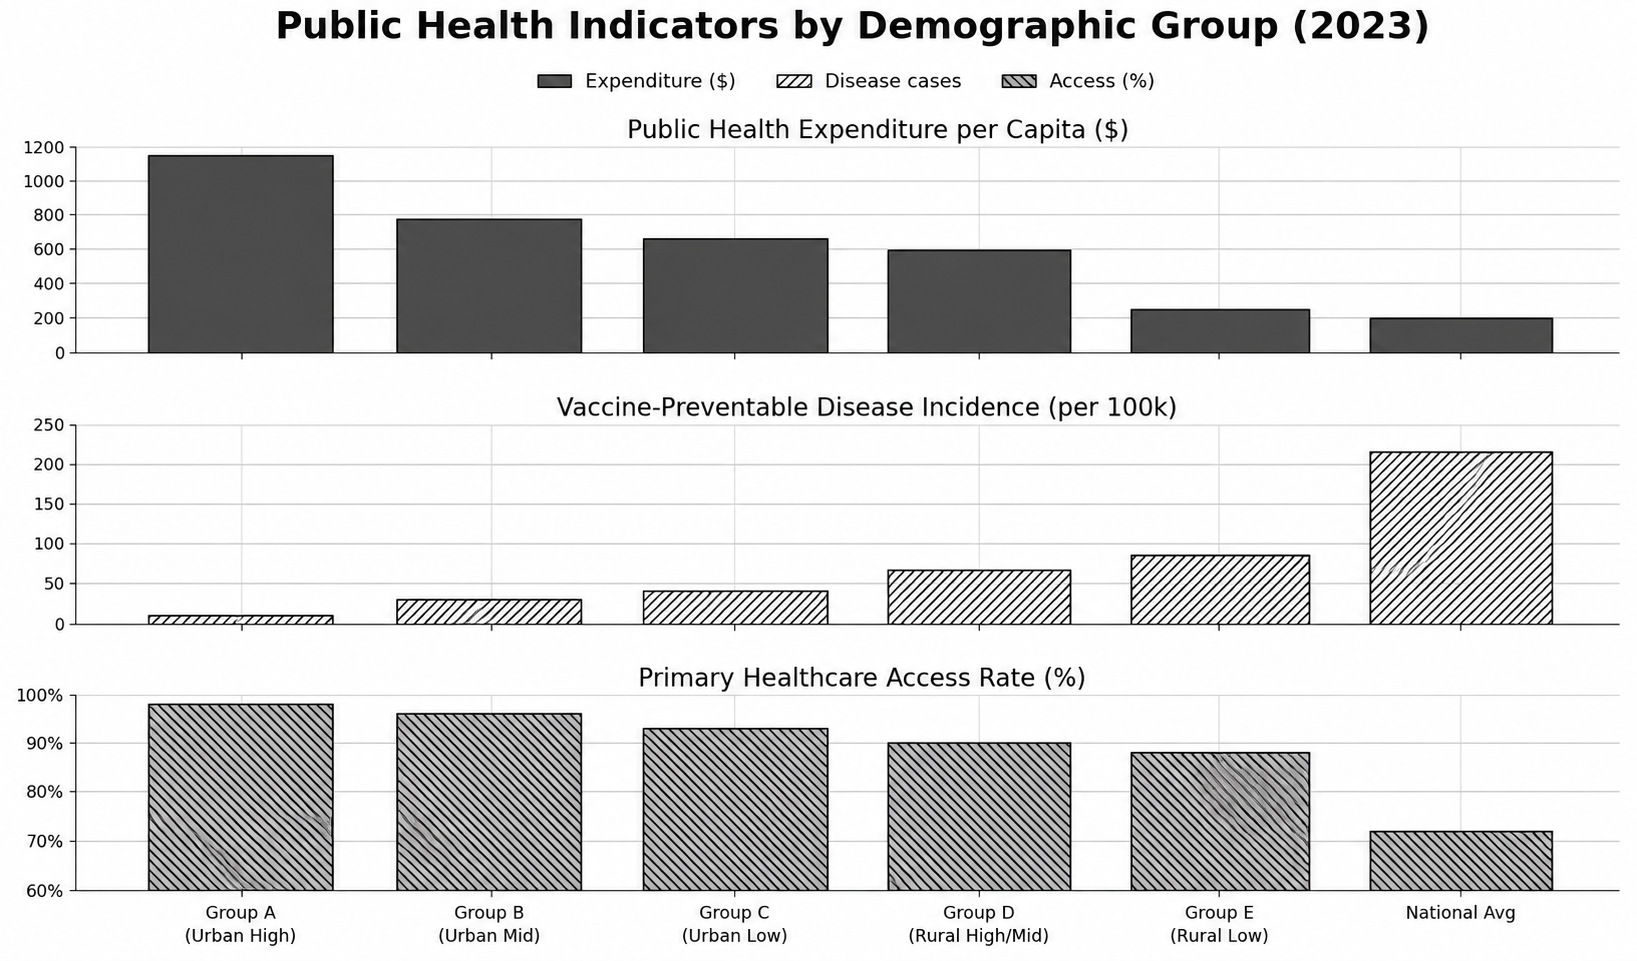
The charts below compare public health expenditure per capita, the incidence of vaccine-preventable diseases and primary healthcare access rates across five selected demographic groups and the national average in a country in 2023.
Summarise the information by selecting and reporting the main features, and make comparisons where relevant.
Want to see your estimated band score?
Check your writing scorePart 1 · Band 9 Sample Answer
The charts compare five demographic groups and the national average in per-capita public health spending, vaccine-preventable disease cases per 100,000 people, and primary healthcare access in 2023.
Overall, expenditure and healthcare access decline progressively from Group A to Group E, while disease incidence moves in the opposite direction. Group A has the most favourable results. The national average is less favourable than every selected group on all three measures, particularly disease incidence.
Public expenditure is highest for Group A, an urban high-income population, at approximately $1,150 per person. The figure falls sharply to around $780 in Group B and then more moderately to roughly $660 and $600 in Groups C and D respectively. Spending on rural low-income Group E is only about $250, although this remains slightly above the national average of $200.
A broadly inverse pattern appears in the disease data. Group A has just 10 cases per 100,000, compared with 30 in Group B and 40 in Group C. Incidence is higher among the rural groups, reaching approximately 65 in Group D and 85 in Group E. The national rate, at about 215, is more than twice that of Group E.
Access rates vary less among the five groups but follow the expenditure ranking exactly. They decrease from 98% in Group A to 96% and 93% in the other urban groups, before slipping to 90% in Group D and 88% in Group E. By comparison, the nationwide figure is markedly lower, at 72%.
Part 1 · Band 8 Sample Answer
The charts illustrate public health expenditure per person, the incidence of diseases preventable by vaccination, and primary healthcare access for five demographic groups and the country as a whole in 2023.
Overall, groups with higher public funding also have wider access to primary care and fewer disease cases. Group A performs best on each indicator, whereas Group E has the least favourable results among the selected populations. However, the national figures are worse than those of Group E in all three respects.
Group A receives about $1,150 per capita, considerably more than Group B, whose expenditure is approximately $780. The amounts for Groups C and D are lower, at around $660 and $600 respectively. There is then a large fall to $250 for Group E, while national spending averages only $200 per person.
Disease incidence shows the reverse order. There are roughly 10 cases per 100,000 people in Group A, rising to 30 in Group B and 40 in Group C. The two rural populations record about 65 cases in Group D and 85 in Group E. In comparison, the nationwide rate reaches approximately 215 cases per 100,000, over five times the level in Group C.
Differences in healthcare access are narrower. Group A records 98%, followed closely by Groups B and C at 96% and 93%. The corresponding proportions for Groups D and E are 90% and 88%. Nevertheless, the national average is just 72%, 16 percentage points below even the lowest selected group.
Part 1 · Band 7 Sample Answer
The bar charts compare public health spending, vaccine-preventable disease cases and access to primary healthcare among five population groups and the national average in 2023.
Overall, Group A has the highest expenditure and healthcare access, as well as the lowest number of disease cases. The figures become less positive from Group A through to Group E. The national average shows the lowest spending and access rate but the greatest incidence of disease.
Public health expenditure for Group A is approximately $1,150 per person. This is much higher than the amounts for Groups B and C, at about $780 and $660 respectively. Group D receives around $600 per capita, while the figure for Group E falls to $250. The national average is lower again, at $200.
The pattern for disease cases is reversed. Group A records only about 10 cases per 100,000 people, compared with 30 in Group B and 40 in Group C. The number rises to approximately 65 for Group D and 85 for Group E. By contrast, the national rate is around 215 cases, considerably higher than the figures for all five groups.
Primary healthcare access decreases more gradually. It stands at 98% for Group A and 96% for Group B. The rate then falls to 93% in Group C, 90% in Group D and 88% in Group E. Despite the relatively small differences among these groups, the national access rate is much lower at 72%, leaving a gap of 26 percentage points compared with Group A.