Task 1 · Dynamic 100% Stacked Bar Chart
You should spend about 20 minutes on this task. Write at least 150 words.
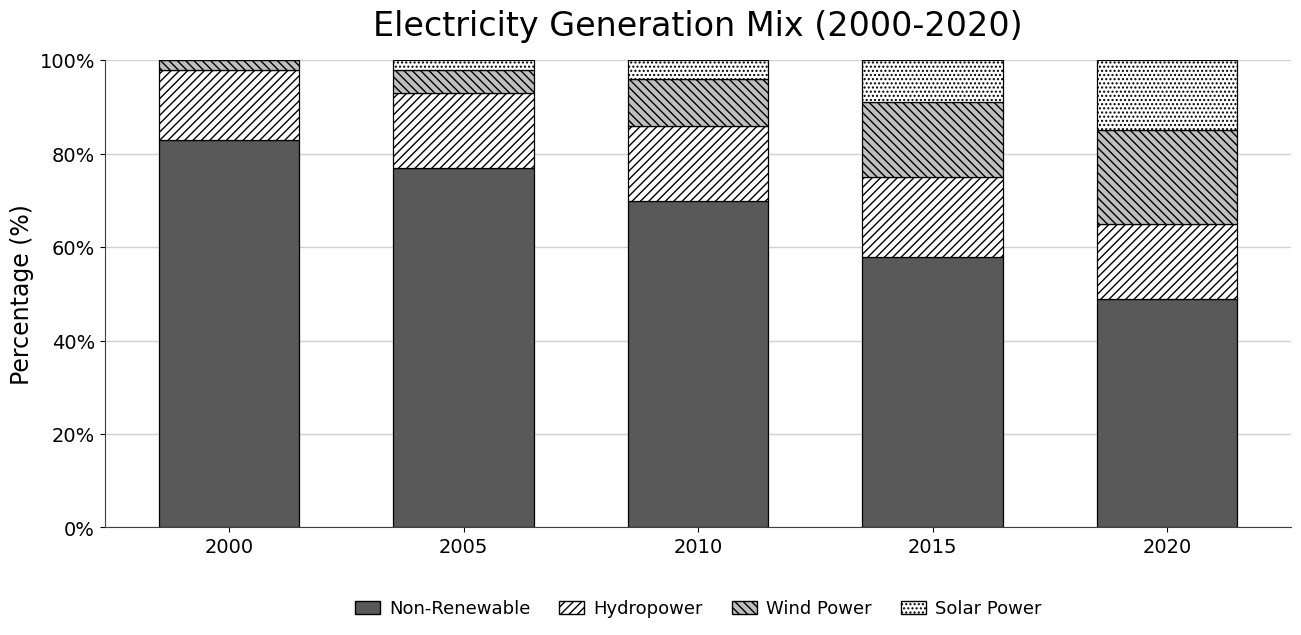
The chart below shows the proportion of a country's total electricity generated from three renewable sources (solar, wind, hydropower) and from non-renewable sources over a twenty-year period (2000-2020).
Summarise the information by selecting and reporting the main features, and make comparisons where relevant.
Want to see your estimated band score?
Check your writing scorePart 1 · Band 9 Sample Answer
The stacked bar chart illustrates how the percentage of electricity produced from non-renewable sources, hydropower, wind and solar power changed in a country at five-year intervals between 2000 and 2020.
Overall, non-renewable energy remained the largest individual source throughout the period, although its share declined substantially from more than four fifths to just under half. Consequently, the combined contribution of renewables rose from 17% to 51%. Hydropower was broadly stable, so most of this expansion came from increasingly important wind and solar power.
In 2000, non-renewable sources accounted for 83% of electricity generation, while hydropower supplied 15%. Wind contributed the remaining 2%, and there was no visible contribution from solar energy. By 2005, the non-renewable proportion had fallen to 77%. Hydropower edged up to 16%, whereas wind and solar represented approximately 6% and 1% respectively.
The shift became more pronounced thereafter. In 2010, 70% of electricity still came from non-renewables, compared with 16% from hydropower, 10% from wind and 4% from solar. The conventional share then dropped to 58% in 2015 and 49% by 2020. Hydropower changed little, standing at about 17% and 16% in those years. By contrast, wind climbed to 16% in 2015 and 20% in 2020, overtaking hydropower, while solar rose steadily to 9% and then 15%.
Part 1 · Band 8 Sample Answer
The chart compares the shares of electricity generated from non-renewable energy and three renewable sources in a country from 2000 to 2020, with figures shown every five years.
Overall, the country became considerably less dependent on non-renewable sources. Although these still formed the largest single category in every year, their proportion fell to below half by 2020. Renewable electricity therefore grew to a slim majority, mainly because wind and solar power expanded, while the contribution of hydropower was relatively unchanged.
At the beginning of the period, non-renewables produced 83% of all electricity. Almost all the rest came from hydropower, at 15%, since wind supplied only 2% and solar made no noticeable contribution. In 2005, the non-renewable figure decreased to 77%, while hydropower rose slightly to around 16%. Wind and solar then accounted for roughly 6% and 1%.
By 2010, the share from non-renewable sources had declined by a further 7 percentage points to 70%. At that time, hydropower provided 16%, wind 10% and solar 4%. This transition accelerated over the final decade: non-renewables fell to 58% in 2015 before reaching 49% in 2020. Hydropower remained close to one sixth of generation in both years. Meanwhile, wind increased from 16% to 20%, becoming the leading renewable source in 2020, and solar advanced from approximately 9% to 15%.
Part 1 · Band 7 Sample Answer
The stacked bar chart shows the percentage of electricity that a country generated from non-renewable sources, hydropower, wind power and solar power between 2000 and 2020. Data is provided at five-year intervals.
Overall, non-renewable sources supplied the greatest share of electricity during the whole period, but their importance decreased steadily. At the same time, renewable energy rose from a relatively small proportion to just over half of total generation. Wind and solar experienced clear growth, whereas hydropower stayed at a similar level.
In 2000, 83% of the country’s electricity was generated from non-renewable sources. Hydropower made up 15%, while wind represented only 2% and solar was not yet visible in the mix. Five years later, the non-renewable share had fallen to 77%. Hydropower was about 16%, compared with approximately 6% for wind and 1% for solar.
Non-renewable electricity continued to decline, reaching 70% in 2010, 58% in 2015 and 49% in 2020. Hydropower remained quite stable at roughly 16% throughout these later years, apart from a small rise to around 17% in 2015. In contrast, wind increased from 10% in 2010 to 16% in 2015 and 20% in 2020. Solar followed the same upward pattern, growing from 4% to about 9% and finally 15%.