Task 1 · Dynamic Mixed Chart
You should spend about 20 minutes on this task. Write at least 150 words.
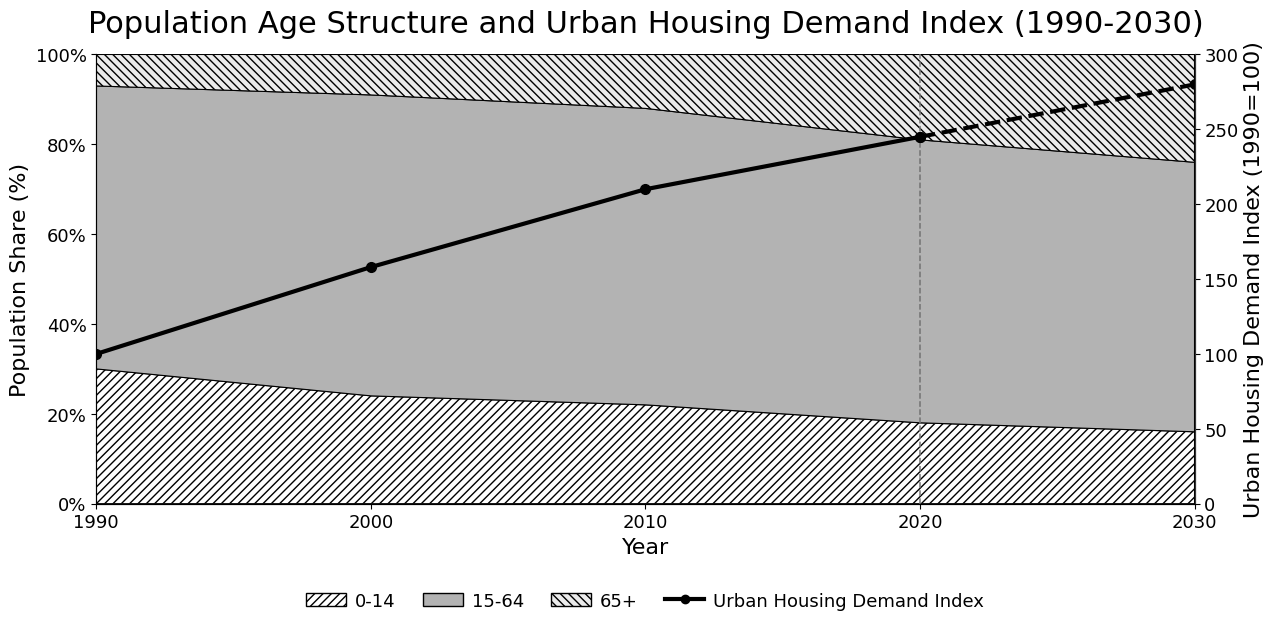
The chart below shows the changes in population age structure (proportion of population aged 0-14, 15-64, and 65+) and the corresponding urban housing demand index in a country from 1990 to 2030 (with projections after 2020).
Summarise the information by selecting and reporting the main features, and make comparisons where relevant.
Want to see your estimated band score?
Check your writing scorePart 1 · Band 9 Sample Answer
The chart traces changes in the age composition of a country’s population between 1990 and 2030 and compares them with movements in an urban housing demand index, for which 1990 equals 100. Figures beyond 2020 are projected.
Overall, the population becomes progressively older across the period, as the share of children contracts while that of people aged 65 and over expands substantially. Although the working-age group remains by far the largest throughout, its proportion is expected to decline after an earlier period of relative stability. Meanwhile, urban housing demand rises continuously and is forecast to reach almost three times its 1990 level by 2030.
In 1990, those aged 15–64 accounted for approximately 63% of the population, compared with 30% for children and only 7% for senior citizens. By 2000, the working-age share had edged up to about 66%, whereas the proportion aged 0–14 had fallen five percentage points to 25%. The elderly group grew modestly to around 9%. In 2010, the corresponding figures were approximately 65%, 23% and 12%.
Ageing becomes more pronounced thereafter. By 2020, children and over-65s each represented roughly 18% of the population, leaving about 64% in the central age band. The 2030 projection puts these shares at 16%, 24% and 60% respectively. Alongside these demographic shifts, the housing index climbed from 100 in 1990 to around 160 in 2000 and 210 in 2010. It reached approximately 245 in 2020 and is predicted to increase further to about 280 by 2030.
Part 1 · Band 8 Sample Answer
The chart presents the proportions of a country’s population in three age groups from 1990 to 2030, together with an index of demand for urban housing. The figures after 2020 are forecasts, and the housing index uses 1990 as its base year of 100.
Overall, the country experienced a clear shift towards an older population. The percentage of people under 15 decreased steadily, while the share aged 65 or above rose throughout and is expected to become considerably larger than the youngest group by 2030. The 15–64 category continued to form the majority, although its proportion is forecast to fall. At the same time, demand for urban housing increased strongly.
In 1990, children made up 30% of the population and people aged 65 and over accounted for about 7%. The remaining 63% were of working age. Ten years later, the child share had dropped to 25%, while the middle group reached its highest level, at roughly 66%, and the oldest group rose to around 9%. By 2010, these proportions stood at about 23%, 65% and 12% respectively.
In 2020, the two dependent-age groups were equal at approximately 18% each, with 15–64-year-olds representing the other 64%. By 2030, the figures are projected to be 16% for children, 60% for working-age adults and 24% for older people. The housing demand index followed a consistent upward path, rising from 100 to about 160 in 2000, 210 in 2010 and 245 in 2020, before a predicted increase to around 280.
Part 1 · Band 7 Sample Answer
The chart shows how the percentages of people in three age groups changed in a country between 1990 and 2030. It also gives an urban housing demand index, with the 1990 figure set at 100. Data after 2020 are projected.
Overall, the proportion of children fell, whereas the percentage of elderly people increased. People aged 15–64 remained the largest group during the whole period, but their share is expected to become smaller by 2030. Urban housing demand rose at every point shown and is forecast to continue increasing.
In 1990, 30% of the population was aged 0–14, while about 63% was in the 15–64 group. People aged 65 and above accounted for the smallest share, at roughly 7%. In 2000, the percentage of children had fallen to 25%. By contrast, the working-age group increased slightly to around 66%, and the oldest group grew to about 9%. In 2010, the three figures were approximately 23%, 65% and 12% respectively.
By 2020, both the youngest and oldest groups represented about 18% of the population, while the share of 15–64-year-olds was roughly 64%. The 2030 figures are expected to be 16%, 60% and 24% respectively. Housing demand also increased considerably: the index rose from 100 in 1990 to around 160 in 2000 and 210 in 2010. It then reached about 245 in 2020 and is predicted to climb to approximately 280 by 2030.