Task 1 · Static Horizontal Bar Chart
You should spend about 20 minutes on this task. Write at least 150 words.
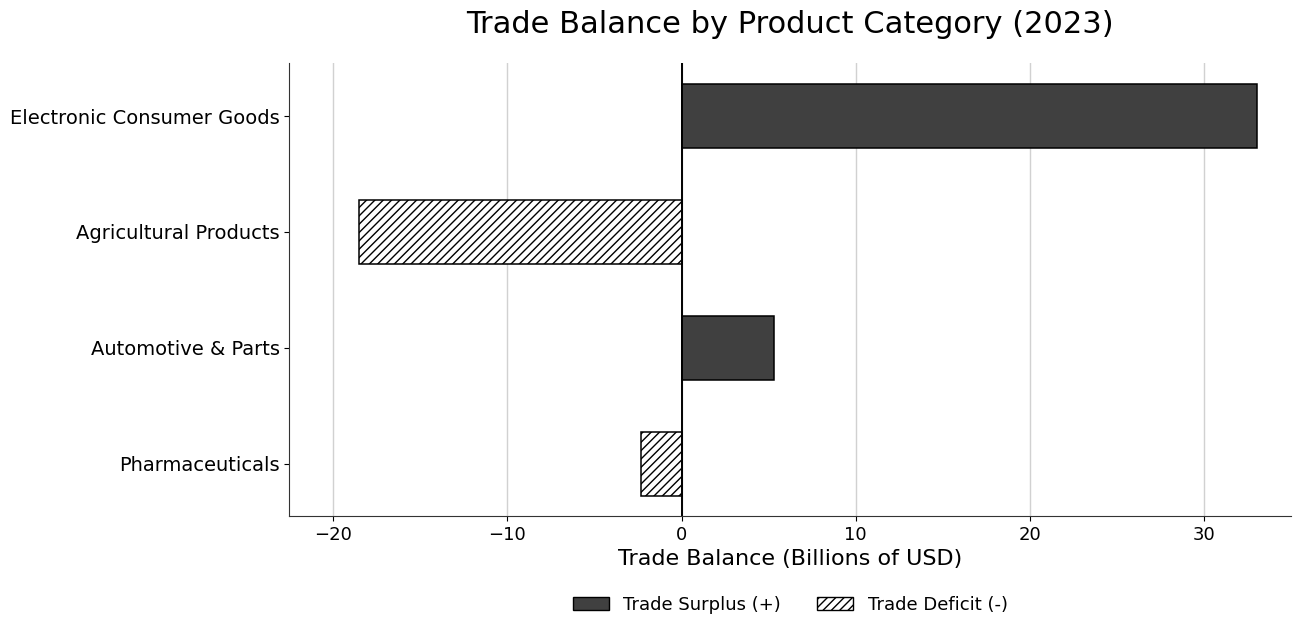
The chart below shows the trade balance (net exports) for four key product categories in a country for the year 2023. A positive value indicates a trade surplus, while a negative value indicates a trade deficit.
Summarise the information by selecting and reporting the main features, and make comparisons where relevant.
Want to see your estimated band score?
Check your writing scorePart 1 · Band 9 Sample Answer
The bar chart compares the value of net exports in four product categories in one country in 2023, measured in billions of US dollars. Bars to the right of zero represent surpluses, whereas those to the left indicate deficits.
Overall, the country exported more than it imported in electronic consumer goods and automotive products and parts, while the reverse was true for agriculture and pharmaceuticals. Electronic goods generated by far the largest balance in either direction, and their surplus was sufficiently high to outweigh both deficits combined. Consequently, the four categories together produced a sizeable positive balance.
Electronic consumer goods recorded a trade surplus of approximately $33 billion. This was more than six times the positive balance for automotive products and parts, which stood at just over $5 billion. Taken together, the two surplus categories therefore contributed around $38 billion in net exports.
Agricultural products showed the largest deficit, at roughly $18.5 billion. This shortfall was more than seven times that for pharmaceuticals, whose imports exceeded exports by only a little over $2 billion. The combined deficit for these two categories was therefore close to $21 billion, or slightly more than half the total surplus recorded by electronics and automotive goods. After the negative balances are deducted from the positive ones, the four sectors shown generated an overall net surplus of approximately $17 billion.
Part 1 · Band 8 Sample Answer
The chart shows the trade balance for four types of products in a country during 2023. The figures are given in billions of US dollars, with positive amounts representing trade surpluses and negative ones indicating deficits.
Overall, two categories produced surpluses and two recorded deficits. Electronic consumer goods had the largest trade balance by a considerable margin, while agricultural products experienced the greatest shortfall. The positive balances were larger in total than the negative ones, meaning that the four categories together showed a net surplus.
The surplus for electronic consumer goods was about $33 billion. By comparison, automotive products and parts recorded a much smaller positive balance of just over $5 billion. Electronics therefore contributed roughly six times as much to the trade balance as the automotive category, and their combined surplus was approximately $38 billion.
On the negative side, agricultural products had a deficit of around $18.5 billion, making this the second-largest absolute figure on the chart. Pharmaceuticals also showed a deficit, but it was relatively minor at slightly more than $2 billion. Together, these two negative balances amounted to about $21 billion. This was around $17 billion less than the total for the surplus categories. Thus, when all four product groups are considered, the country achieved an overall positive balance of approximately $17 billion.
Part 1 · Band 7 Sample Answer
The bar chart presents the trade balance for four product categories in a country in 2023. Values are measured in billions of US dollars. A positive value means exports exceeded imports, while a negative value means imports were higher.
Overall, electronic consumer goods and automotive products and parts had trade surpluses. In contrast, agricultural products and pharmaceuticals recorded deficits. Electronic goods had the largest figure on the chart, whereas pharmaceuticals had the smallest balance in absolute terms. The surpluses were also larger than the deficits when the four categories were added together.
Electronic consumer goods produced a surplus of around $33 billion. This was much higher than the figure for automotive products and parts, which was just over $5 billion. The two positive categories therefore had a combined trade surplus of approximately $38 billion.
Agricultural products showed a deficit of roughly $18.5 billion. This was the largest negative balance and was more than three times the automotive surplus. The pharmaceutical deficit was considerably smaller, at a little over $2 billion. Together, the two deficit categories totalled about $21 billion. As a result, the combined surplus was around $17 billion greater than the combined deficit, leaving the four categories shown with an overall positive trade balance of approximately $17 billion.