Task 1 · Static Table
You should spend about 20 minutes on this task. Write at least 150 words.
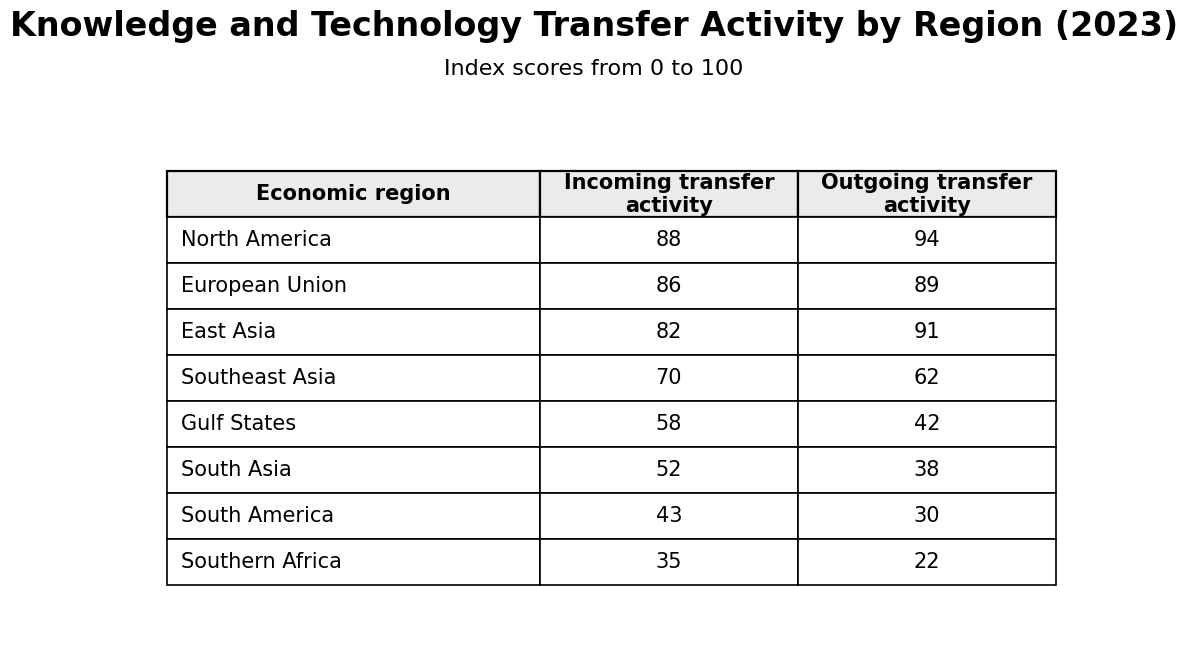
The table below compares eight economic regions in terms of their incoming and outgoing knowledge and technology transfer activity in 2023. The figures are given as index scores from 0 to 100.
Summarise the information by selecting and reporting the main features, and make comparisons where relevant.
Want to see your estimated band score?
Check your writing scorePart 1 · Band 9 Sample Answer
The table compares the intensity of incoming and outgoing knowledge and technology transfer across eight economic regions in 2023, using index scores on a scale from 0 to 100.
Overall, North America recorded the highest level of activity in both directions, while Southern Africa had the lowest scores. The two measures were broadly correlated: regions with stronger incoming activity also tended to transfer more knowledge and technology outwards. However, outgoing activity exceeded incoming activity only in the three leading regions, whereas the reverse was true everywhere else.
Among the highest-performing regions, North America scored 88 for incoming transfers and 94 for outgoing ones. The European Union followed closely on the incoming measure, at 86, but its outgoing score of 89 was slightly below East Asia’s 91. East Asia therefore ranked third for incoming activity, with 82, but second for outgoing transfers. Southeast Asia occupied a clear middle position, registering 70 and 62 respectively, although its outgoing score was 29 points below East Asia’s.
The remaining four regions all achieved incoming scores below 60. The Gulf States led this group with 58, followed by South Asia at 52, South America at 43 and Southern Africa at 35. Their outgoing figures declined in the same order, from 42 to 38, 30 and finally 22. The Gulf States showed the largest imbalance, with incoming activity surpassing outgoing activity by 16 points, compared with gaps of 13 or 14 points in the other three regions.
Part 1 · Band 8 Sample Answer
The table shows the index scores for incoming and outgoing knowledge and technology transfer activity in eight economic regions in 2023.
Overall, North America was the most active region for both types of transfer, whereas Southern Africa had the lowest figures. In general, regions with high incoming scores also performed strongly in outgoing transfers. Another clear feature is that the top three regions had higher outgoing than incoming scores, while the other five showed the opposite pattern.
North America achieved scores of 88 for incoming activity and 94 for outgoing activity. The European Union was close behind, with 86 and 89 respectively. East Asia had a slightly lower incoming score of 82, but its outgoing figure reached 91, placing it ahead of the European Union on this measure. There was then a noticeable fall to Southeast Asia, whose scores were 70 for incoming transfers and 62 for outgoing ones.
The four lower-ranked regions all received incoming scores of less than 60. The Gulf States recorded 58 for incoming activity, compared with only 42 for outgoing transfers, which was the widest difference in the table. South Asia followed with scores of 52 and 38. The figures were lower still in South America, at 43 and 30, while Southern Africa came last with 35 for incoming activity and just 22 for outgoing activity. Thus, the ranking of these four regions was the same for both measures.
Part 1 · Band 7 Sample Answer
The table compares incoming and outgoing knowledge and technology transfer activity in eight regions during 2023. The information is presented as index scores between 0 and 100.
Overall, North America had the highest scores for both incoming and outgoing transfers, while Southern Africa had the lowest. The three strongest regions recorded more outgoing than incoming activity. By contrast, incoming activity was higher in each of the other five regions.
North America ranked first, with an incoming score of 88 and an outgoing score of 94. The European Union had a similar incoming figure of 86, together with 89 for outgoing transfers. East Asia scored 82 for incoming activity and 91 for outgoing activity. Although its incoming score was lower than that of the European Union, its outgoing score was two points higher. Southeast Asia was some distance behind these regions, at 70 and 62 respectively.
Among the remaining regions, the Gulf States had the highest incoming score, at 58, but its outgoing figure was only 42. South Asia recorded 52 for incoming transfers and 38 for outgoing ones. The corresponding scores for South America were 43 and 30. Finally, Southern Africa had the lowest levels of transfer activity, with figures of 35 for incoming and 22 for outgoing transfers. The gap between the two measures was greatest in the Gulf States, at 16 points.