Task 1 · Static Bubble Chart
You should spend about 20 minutes on this task. Write at least 150 words.
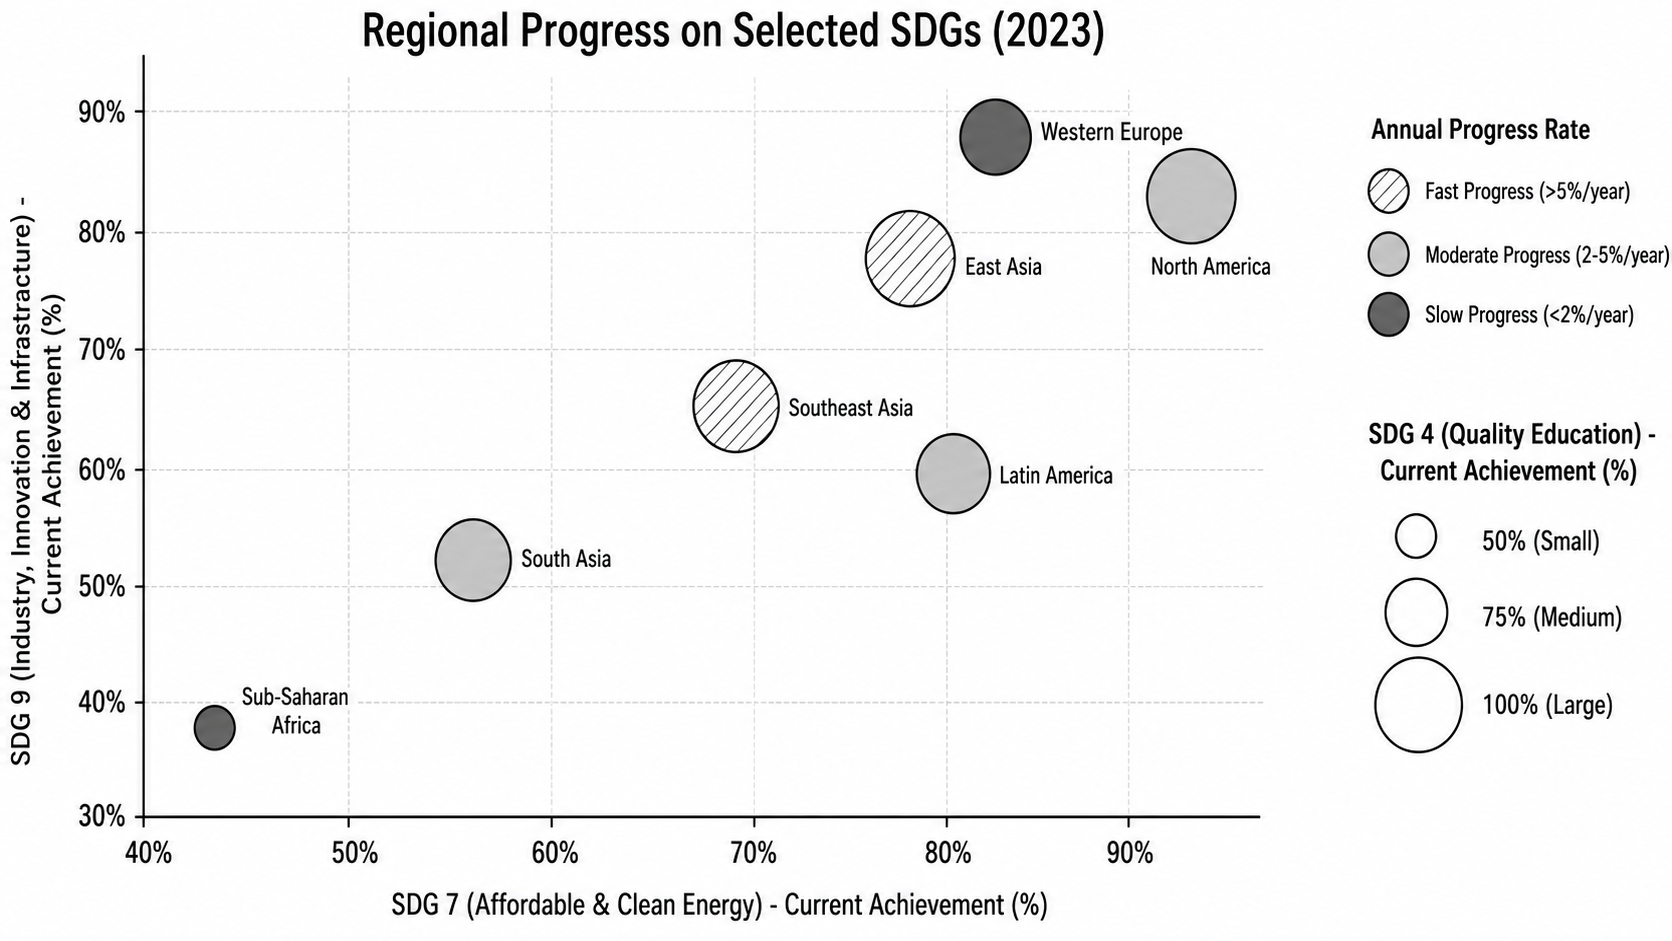
The bubble chart below compares seven regions in terms of their current achievement in SDG 7 and SDG 9 in 2023. The size of each bubble represents achievement in SDG 4, while the shading indicates the annual rate of progress.
Summarise the information by selecting and reporting the main features, and make comparisons where relevant.
Want to see your estimated band score?
Check your writing scorePart 1 · Band 9 Sample Answer
The bubble chart compares seven world regions in 2023 according to their achievement in SDG 7, concerning affordable and clean energy, and SDG 9, relating to industry, innovation and infrastructure. Bubble size shows SDG 4 achievement, while the pattern or shade represents the annual pace of progress.
Overall, North America and Western Europe record the strongest current results, although both are progressing less rapidly than East and Southeast Asia. Sub-Saharan Africa ranks lowest on all three achievement measures. The largest bubbles are concentrated among North America and the two faster-growing Asian regions.
North America leads SDG 7 at approximately 93% and achieves about 83% for SDG 9. Western Europe, by contrast, has the highest SDG 9 figure, at roughly 88%, alongside an SDG 7 result of around 83%. However, North America is making only moderate progress and Western Europe slow progress. East Asia records almost identical results of about 78% on both axes, while Southeast Asia stands at approximately 69% for SDG 7 and 65% for SDG 9. Both regions are advancing at over 5% annually and have large bubbles, indicating high educational achievement.
Latin America achieves around 80% for clean energy but only 60% for industry and infrastructure, whereas South Asia scores lower, at approximately 56% and 52% respectively. Both show moderate progress and medium-sized bubbles. Sub-Saharan Africa is the clear outlier, with only about 43% achievement in SDG 7 and 38% in SDG 9. Its small, dark bubble also indicates the lowest educational result and progress below 2% per year.
Part 1 · Band 8 Sample Answer
The bubble chart presents the performance of seven regions in three Sustainable Development Goals in 2023. The horizontal and vertical axes show achievement in SDG 7 and SDG 9 respectively, while bubble size represents SDG 4. Different shading indicates whether annual progress is fast, moderate or slow.
Overall, North America and Western Europe have the highest current achievement levels, while Sub-Saharan Africa performs worst. East Asia and Southeast Asia are the only regions making fast progress. Larger bubbles generally appear among the better-performing regions, particularly North America and the two East Asian areas.
North America has the highest SDG 7 result, at about 93%, together with an SDG 9 score of approximately 83%. Western Europe leads SDG 9 at around 88%, while achieving roughly 83% in SDG 7. Despite these strong positions, their annual progress is moderate and slow respectively. East Asia records about 78% on both measures, and Southeast Asia achieves approximately 69% in clean energy and 65% in industry and infrastructure. Both have large, striped bubbles, showing high educational achievement and growth above 5% per year.
Latin America scores around 80% in SDG 7 but only 60% in SDG 9. South Asia has lower figures of roughly 56% and 52%. These two regions are making moderate progress and have medium-sized bubbles. Finally, Sub-Saharan Africa records just 43% for SDG 7 and 38% for SDG 9. Its bubble is both the smallest and darkly shaded, indicating low SDG 4 achievement and annual progress below 2%.
Part 1 · Band 7 Sample Answer
The bubble chart compares seven regions according to their achievement in SDG 7 and SDG 9 in 2023. The size of the bubbles shows achievement in quality education, or SDG 4, and the shading gives the rate of annual progress.
Overall, North America and Western Europe have the highest current figures, while Sub-Saharan Africa has the lowest. East Asia and Southeast Asia are progressing the fastest. The regions with high achievement generally have larger bubbles than those with lower results.
North America has the highest SDG 7 score at approximately 93%, and its SDG 9 figure is around 83%. Western Europe records about 83% for SDG 7 and has the highest SDG 9 result, at roughly 88%. However, North America is making moderate progress, while progress in Western Europe is slow. East Asia has similar figures of around 78% for both goals. Southeast Asia reaches about 69% in SDG 7 and 65% in SDG 9. Both Asian regions have large, striped bubbles, which show strong education results and fast annual progress.
Latin America performs better in SDG 7, at around 80%, than in SDG 9, at 60%. South Asia records lower figures of about 56% and 52% respectively. Both regions show moderate progress and medium educational achievement. Sub-Saharan Africa is last, with approximately 43% for clean energy and 38% for industry and infrastructure. It also has the smallest bubble and a slow rate of progress.