Task 1 · Static Scatter Plot
You should spend about 20 minutes on this task. Write at least 150 words.
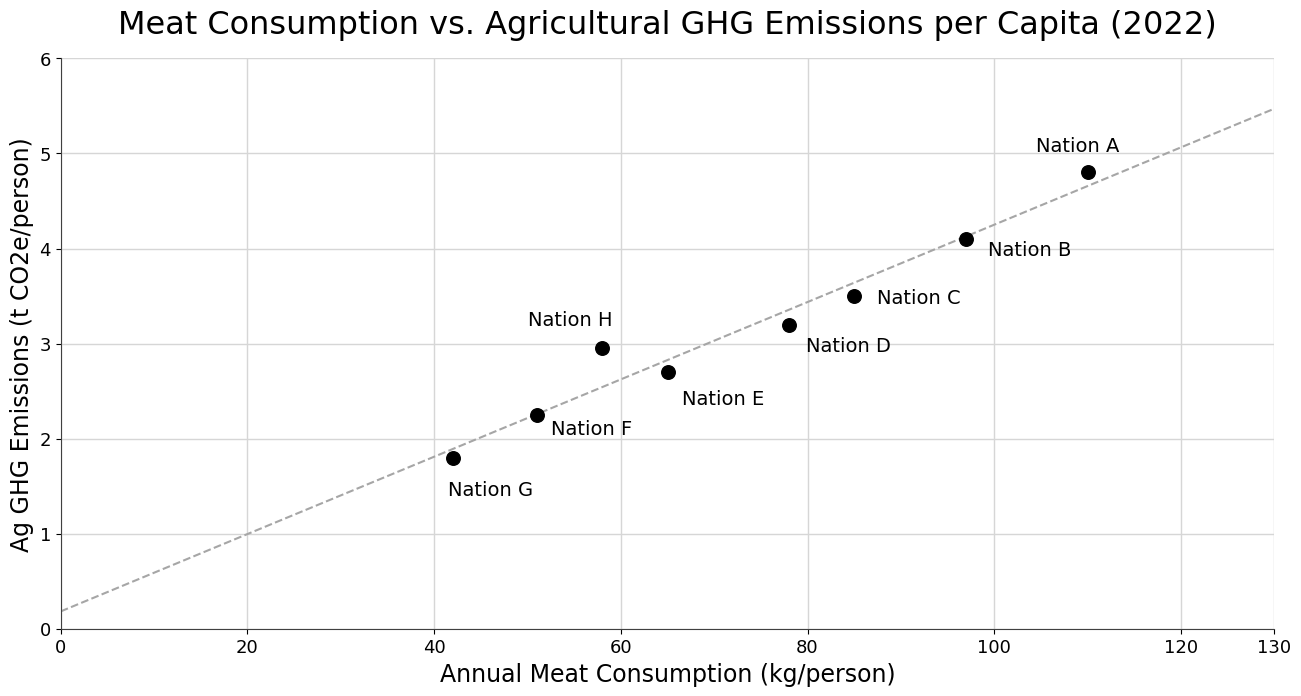
The chart below illustrates the relationship between a country's annual per capita meat consumption and its per capita greenhouse gas emissions from agriculture, comparing data for eight nations in 2022.
Summarise the information by selecting and reporting the main features, and make comparisons where relevant.
Want to see your estimated band score?
Check your writing scorePart 1 · Band 9 Sample Answer
The scatter plot compares eight countries in terms of average annual meat consumption per person and per capita greenhouse gas emissions from agriculture in 2022. Meat intake is measured in kilograms, while emissions are given in tonnes of carbon dioxide equivalent.
Overall, there was a strong positive association between the two variables: countries consuming more meat generally produced more agricultural emissions per person. Nations A and G occupied the opposite extremes, while Nation H was the clearest exception to the otherwise close relationship, recording relatively high emissions for its level of meat consumption.
Nation A had by far the highest meat intake, at approximately 110 kg per person, accompanied by emissions of about 4.8 tonnes. Nation B followed at just under 100 kg and slightly above 4 tonnes. The next two countries also conformed closely to the upward pattern: Nation C consumed around 85 kg and emitted 3.5 tonnes, compared with approximately 78 kg and 3.2 tonnes in Nation D.
At the lower end, Nation G recorded the smallest figures, at roughly 42 kg of meat and 1.8 tonnes of emissions per person. Nation F stood at about 51 kg and 2.2 tonnes, while Nation E registered approximately 65 kg and 2.7 tonnes. Nation H was unusual: despite consuming only around 58 kg, less than Nation E, it generated almost 3 tonnes of agricultural emissions, placing it above the general trend line.
Part 1 · Band 8 Sample Answer
The chart shows the relationship between annual meat consumption and agricultural greenhouse gas emissions per person across eight nations in 2022. The two measures are expressed in kilograms per person and tonnes of carbon dioxide equivalent per person respectively.
Overall, greater meat consumption was generally linked to higher emissions. Nation A had the highest values for both measures, whereas Nation G recorded the lowest. Most countries were situated fairly close to the trend line, although Nation H produced noticeably more emissions than might be expected from its meat consumption.
At the upper end, people in Nation A consumed about 110 kg of meat annually, and the country generated approximately 4.8 tonnes of agricultural emissions per capita. Nation B ranked second, with just under 100 kg and a little over 4 tonnes. Nations C and D occupied the middle-to-upper range. Their consumption figures were roughly 85 kg and 78 kg, while their emissions stood at about 3.5 and 3.2 tonnes.
The remaining countries generally had lower figures. Nation E consumed around 65 kg of meat per person and emitted 2.7 tonnes, compared with about 51 kg and 2.2 tonnes in Nation F. Nation G had the lowest consumption, at approximately 42 kg, together with emissions of only 1.8 tonnes. By contrast, Nation H emitted almost 3 tonnes despite consuming around 58 kg, so its emissions exceeded those of Nation E even though its meat intake was lower.
Part 1 · Band 7 Sample Answer
The scatter chart compares meat consumption per person with per capita greenhouse gas emissions from agriculture in eight nations in 2022. Consumption is shown in kilograms per year, and emissions are measured in tonnes of carbon dioxide equivalent.
Overall, there was a clear positive relationship between the two figures. Countries where people ate more meat usually had higher agricultural emissions. Nation A was highest on both measures, while Nation G had the lowest figures. Nation H was the main exception to the general pattern.
Nation A consumed approximately 110 kg of meat per person and produced about 4.8 tonnes of emissions. This was followed by Nation B, where consumption was just below 100 kg and emissions were slightly above 4 tonnes. Nation C recorded around 85 kg and 3.5 tonnes, while the figures for Nation D were lower, at roughly 78 kg and 3.2 tonnes.
Among the countries with lower meat consumption, Nation E stood at about 65 kg per person, with emissions of around 2.7 tonnes. Nation F consumed close to 51 kg and emitted about 2.2 tonnes. Nation G had the smallest amounts, at approximately 42 kg and 1.8 tonnes. However, Nation H did not follow the pattern as closely. Its people consumed only around 58 kg of meat, but its emissions reached nearly 3 tonnes, which was higher than the level in Nation E.