Task 1 · Static Table
You should spend about 20 minutes on this task. Write at least 150 words.
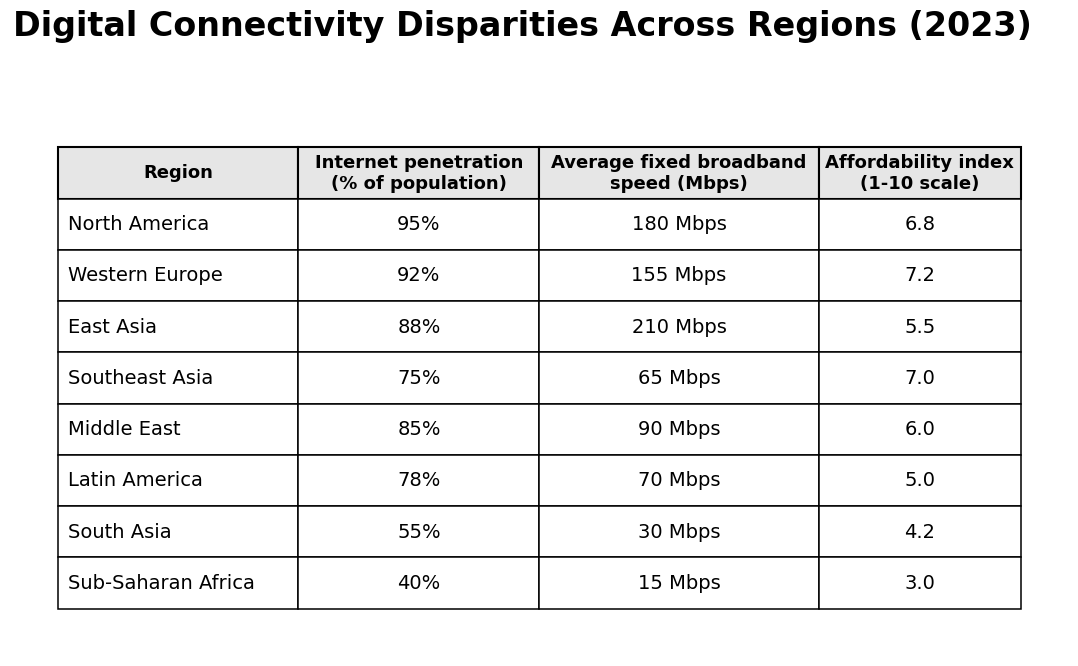
The table below compares eight regions in terms of internet penetration, average fixed broadband speed and an affordability index in 2023.
Summarise the information by selecting and reporting the main features, and make comparisons where relevant.
Want to see your estimated band score?
Check your writing scorePart 1 · Band 9 Sample Answer
The table compares internet use, average fixed broadband speed and affordability across eight regions in 2023. The affordability index uses a ten-point scale.
Overall, North America had the most widespread internet access, East Asia provided the fastest broadband, and Western Europe achieved the highest affordability score. Sub-Saharan Africa ranked last on all three indicators. Although stronger internet penetration was generally associated with faster and more affordable connections, East and Southeast Asia were notable exceptions.
Internet use was highest in North America and Western Europe, at 95% and 92% respectively, while East Asia followed at 88%. North America’s average speed of 180 Mbps exceeded Western Europe’s 155 Mbps, but both were slower than East Asia’s leading figure of 210 Mbps. Western Europe nevertheless topped the affordability index at 7.2, compared with 6.8 in North America and only 5.5 in East Asia.
Among the middle-ranking regions, the Middle East had a penetration rate of 85% and a speed of 90 Mbps, with an affordability score of 6.0. Latin America and Southeast Asia had similar access levels, at 78% and 75%, and speeds of 70 and 65 Mbps. However, Southeast Asia’s affordability rating was considerably higher, at 7.0 versus 5.0. The largest digital disadvantages appeared in South Asia and Sub-Saharan Africa: their penetration rates were just 55% and 40%, while speeds fell to 30 and 15 Mbps. Their affordability indices were also the lowest, at 4.2 and 3.0 respectively.
Part 1 · Band 8 Sample Answer
The table compares internet penetration, average fixed broadband speeds and affordability scores across eight world regions in 2023.
Overall, North America recorded the highest percentage of internet users, whereas East Asia had the fastest broadband connection. Western Europe received the highest affordability rating. Sub-Saharan Africa had the lowest figures for every measure. Wider access generally coincided with faster, more affordable connections.
North America had the greatest internet penetration, at 95%, followed closely by Western Europe at 92%. Their average broadband speeds were also high, at 180 Mbps and 155 Mbps respectively. However, East Asia led the speed ranking with 210 Mbps, despite having a lower penetration rate of 88%. Its affordability score was 5.5, below the figures of 6.8 in North America and 7.2 in Western Europe.
The Middle East ranked next for internet access, with 85% of its population online, while its broadband speed and affordability score were 90 Mbps and 6.0. Latin America recorded 78% penetration and a speed of 70 Mbps. Southeast Asia had similar figures of 75% and 65 Mbps, but its affordability index reached 7.0, the second-highest score overall and two points above Latin America’s 5.0.
Connectivity was much weaker in the final two regions. South Asia had an internet penetration rate of 55%, an average speed of 30 Mbps and an affordability score of 4.2. Sub-Saharan Africa came last with only 40% penetration, broadband averaging 15 Mbps and an affordability rating of 3.0.
Part 1 · Band 7 Sample Answer
The table shows differences in internet access, fixed broadband speed and affordability across eight regions in 2023. Internet penetration is given as a percentage, speed is measured in Mbps, and affordability is scored from 1 to 10.
Overall, North America had the highest internet penetration, while East Asia had the fastest broadband. Western Europe recorded the highest affordability score. Sub-Saharan Africa had the lowest result in all three categories. Generally, regions with greater internet access also had faster connections.
Internet penetration reached 95% in North America, compared with 92% in Western Europe and 88% in East Asia. East Asia had the fastest average broadband speed, at 210 Mbps. This was followed by North America at 180 Mbps and Western Europe at 155 Mbps. However, Western Europe had the highest affordability index of 7.2, while North America scored 6.8 and East Asia received 5.5.
The Middle East had 85% internet penetration and an average speed of 90 Mbps, together with an affordability score of 6.0. Latin America recorded 78%, 70 Mbps and 5.0 respectively. Southeast Asia had slightly lower internet access and speed, at 75% and 65 Mbps, but its affordability rating of 7.0 was the second highest in the table.
The lowest figures were seen in South Asia and Sub-Saharan Africa. South Asia recorded 55% penetration, a speed of 30 Mbps and an affordability score of 4.2. The corresponding results for Sub-Saharan Africa were only 40%, 15 Mbps and 3.0.